HelpDesk
How to Create a Computer Network Diagram

 Cisco Network Diagrams
Cisco Network Diagrams solution extends ConceptDraw DIAGRAM with the best characteristics of network diagramming software. Included samples, templates and libraries of built-in standardized vector Cisco network icons and Cisco symbols of computers, network devices, network appliances and other Cisco network equipment will help network engineers, network designers, network and system administrators, as well as other IT professionals and corporate IT departments to diagram efficiently the network infrastructure, to visualize computer networks topologies, to design Cisco computer networks, and to create professional-looking Cisco Computer network diagrams, Cisco network designs and schematics, Network maps, and Network topology diagrams in minutes.
 Computer Network Diagrams
Computer Network Diagrams solution extends ConceptDraw DIAGRAM software with samples, templates and libraries of vector icons and objects of computer network devices and network components to help you create professional-looking Computer Network Diagrams, to plan simple home networks and complex computer network configurations for large buildings, to represent their schemes in a comprehensible graphical view, to document computer networks configurations, to depict the interactions between network's components, the used protocols and topologies, to represent physical and logical network structures, to compare visually different topologies and to depict their combinations, to represent in details the network structure with help of schemes, to study and analyze the network configurations, to communicate effectively to engineers, stakeholders and end-users, to track network working and troubleshoot, if necessary.
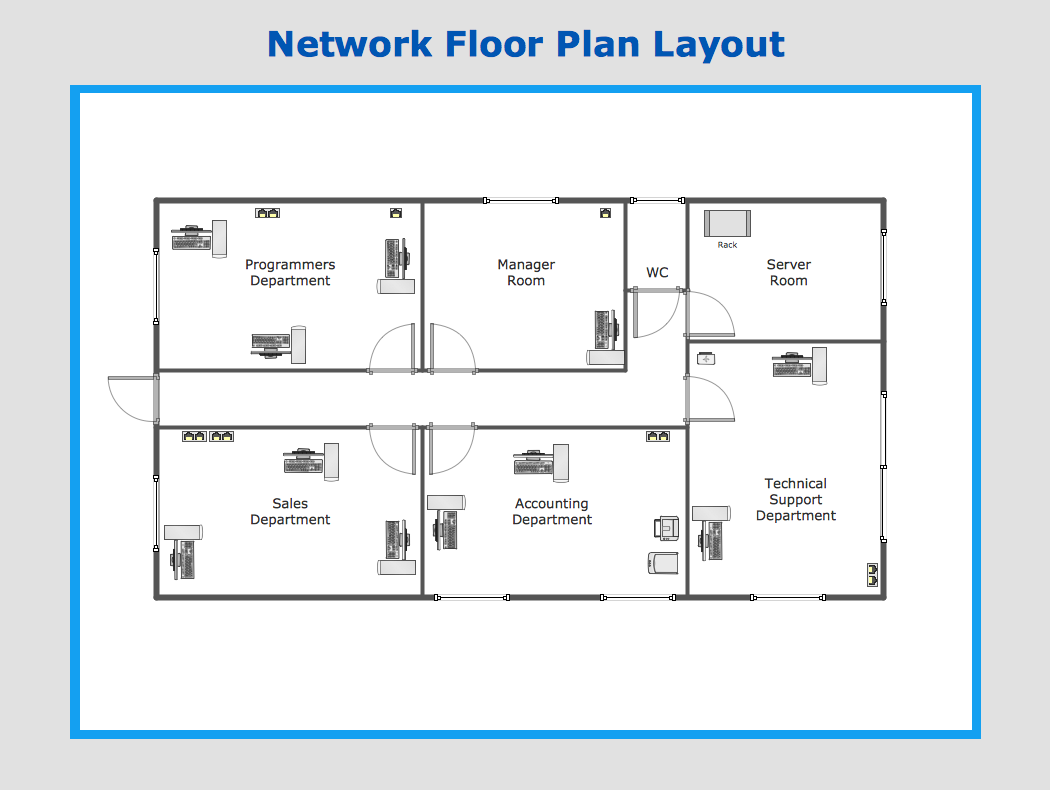
Network Layout

 Telecommunication Network Diagrams
Telecommunication Network Diagrams solution extends ConceptDraw DIAGRAM software with samples, templates, and great collection of vector stencils to help the specialists in a field of networks and telecommunications, as well as other users to create Computer systems networking and Telecommunication network diagrams for various fields, to organize the work of call centers, to design the GPRS networks and GPS navigational systems, mobile, satellite and hybrid communication networks, to construct the mobile TV networks and wireless broadband networks.
 Computer and Networks Area
The solutions from Computer and Networks Area of ConceptDraw Solution Park collect samples, templates and vector stencils libraries for drawing computer and network diagrams, schemes and technical drawings.
HelpDesk
How to Create an Interactive Voice Response (IVR) Diagram
 Diagram")
HelpDesk
Accounting Information Systems Flowchart Symbols

HelpDesk
How to Create a Data Flow Diagram

- How to Draw a Computer Network Diagrams | Process Flowchart ...
- Flow Chart The Simple Computer Network Systems
- Accounting Flowcharts | How to Create Flowcharts for an Accounting ...
- How to Draw a Computer Network Diagrams
- How to Create Flowcharts for an Accounting Information System ...
- Computer network system design diagram
- Computer network system design diagram | How to Draw a ...
- How to Draw a Computer Network Diagrams | Computer Network ...
- Telecommunication Network Diagrams | Telecommunication ...
- How To Convert a Computer Network Diagram to Adobe PDF Using ...
- IDEF1X Standard | Computer network system design diagram ...
- Basic Flowchart Symbols and Meaning | Computer Network ...
- How to Create a Telecommunication Network Diagram in ...
- Make A Chart Depicting The Services Of Computers
- Hierarchy Diagram Of Type Of Software In A Computer System
- Computer Network Diagrams | Computer network system design ...
- Purchasing Cycle Accounting Information System Flowchart
- 5 Level pyramid model diagram - Information systems types ...
- How to Create Flowcharts for an Accounting Information System ...
- Flowchart Of Computerized Accounting System