DroidDia prime
.jpg "droiddia prime")
DroidDia PRO unlocker
.jpg "droiddia pro unlocker")
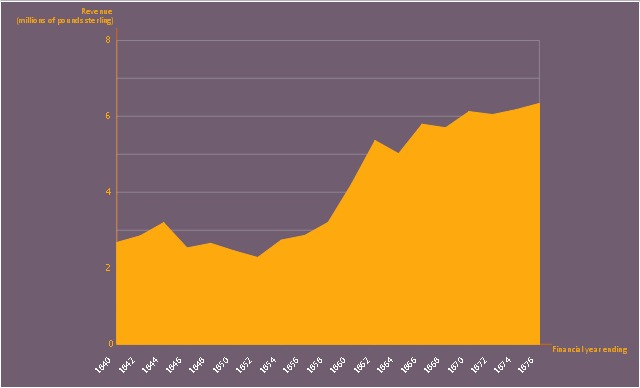
This area chart sample shows the revenue collected by the East India Company (after 1858 the British government) from salt (including inland and port taxes and sale of government salt). It was designed on the base of the Wikimedia Commons file: British India salt revenue 1840-1877.png.
[commons.wikimedia.org/ wiki/ File:British_ India_ salt_ revenue_ 1840-1877.png]
This file is licensed under the Creative Commons Attribution-Share Alike 3.0 Unported license. [creativecommons.org/ licenses/ by-sa/ 3.0/ deed.en]
"The Inland Customs Line which incorporated the Great Hedge of India (or Indian Salt Hedge[1]) was a customs barrier built by the British across India primarily to collect the salt tax. The customs line was begun while India was under the control of the East India Company but continued into the period of direct British rule. The line had its beginnings in a series of customs houses that were established in Bengal in 1803 to prevent the smuggling of salt to avoid the tax. These customs houses were eventually formed into a continuous barrier that was brought under the control of the Inland Customs Department in 1843." [Inland Customs Line. Wikipedia]
The area graph example "British India salt revenue 1840-1877" was created using the ConceptDraw PRO diagramming and vector drawing software extended with the Area Charts solution from the Graphs and Charts area of ConceptDraw Solution Park.
Area chart
The vector stencils library "Professions" contains 58 people clipart images of different professions you can use in your presentations, illustrations and infographics.
"Electronic clip art is available in several different file formats. It is important for clip art users to understand the differences between file formats so that they can use an appropriate image file and get the resolution and detail results they need.
Clip art file formats are divided into 2 different types: bitmap or vector graphics. ...
In contrast to the grid format of bitmap images, Vector graphics file formats use geometric modeling to describe an image as a series of points, lines, curves, and polygons. Because the image is described using geometric data instead of fixed pixels, the image can be scaled to any size while retaining "resolution independence", meaning that the image can be printed at the highest resolution a printer supports, resulting in a clear, crisp image. Vector file formats are usually superior in resolution and ease of editing as compared to bitmap file formats, but are not as widely supported by software and are not well-suited for storing pixel-specific data such as scanned photographs. In the early years of electronic clip art, vector illustrations were limited to simple line art representations." [Clip art. Wikipedia]
The clip art example "Professions - Vector stencils library" was created using the ConceptDraw PRO diagramming and vector drawing software extended with the People solution from the Illustration area of ConceptDraw Solution Park.
www.conceptdraw.com/ solution-park/ illustrations-people
Builder 1

System administrator

Worker of conveyor

Clerk 1

Clerk 2

Student 2

Student 3

Student 1

Dispatcher 1

Accountant

Gardener

Lawyer

Jurist

Judge

Consultant

Manager

Director

Programmer

Architect

Pilot

Policeman

Secretary

Security officer

Clerk 3

Musician

Presenter

Athlete

Artist

Announcer

Photographer

Hairdresser

Florist

Spaceman

Engineer

Reporter

Tailor

Dispatcher 2

Biologist

Chemist

Dentist

Priest

Soldier

Doctor

Driver

Carpenter

Fireman

Seaman

Builder 2

Postman

Miner

Waiter

Cleaner

Cashier

Shop assistant

Cook

Flight attendant

Teacher

Hall porter

HelpDesk
How to Change the Form and Color of a Topic’s Line in Your Mind Map

HelpDesk
How to Set Line Jumps for Smart Connectors in ConceptDraw PRO

 Line Graphs
How to draw a Line Graph with ease? The Line Graphs solution extends the capabilities of ConceptDraw PRO v10 with professionally designed templates, samples, and a library of vector stencils for drawing perfect Line Graphs.
The 3D vertical bar graph sample shows the Iran internet users per 100 person from 2000 to 2011. It was designed on the base of the Commons Wikimedia file: Iran internet users per 100 person.png.
[commons.wikimedia.org/ wiki/ File:Iran_ internet_ users_ per_ 100_ person.png]
This file is licensed under the Creative Commons Attribution-Share Alike 3.0 Unported license. [creativecommons.org/ licenses/ by-sa/ 3.0/ deed.en]
The data source is World Bank: [data.worldbank.org/ country/ iran-islamic-republic]
"In 1993 Iran became the second country in the Middle East to be connected to the Internet, and since then the government has made significant efforts to improve the nation's ICT infrastructure. Iran's national Internet connectivity infrastructure is based on two major networks: the public switched telephone network (PSTN) and the public data network. The PSTN provides a connection for end-users to Internet service providers (ISPs) over mostly digital lines and supports modem-based connections. The Data Communication Company of Iran (DCI), a subsidiary of TCI, operates the public data network." [Internet in Iran. Wikipedia]
The 3D column chart example "Iran internet users per 100 person" was created using the ConceptDraw PRO diagramming and vector drawing software extended with the Bar Graphs solution from the Graphs and Charts area of ConceptDraw Solution Park.
3D Column chart

- Power Lines Png
- Curve Decoration Lines Png
- Geo Map - Europe - Italy | Plain Border Two Lines Png
- Labels Lines Png
- Horizontal White Line Png
- Electric Lines Png Vector
- Graphic Design Lines Png
- Blue Vector Lines Png
- Mpls Cloud Png
- Png Lines
- Curv Lines In Png
- Line Hockey Png
- Vertical White Line Transparent Png
- Colorful Paper Lines Png
- Football Field Lines Png
- Process Line Png
- Visual Lines Icon Png
- Volleyball court dimensions | Olympic Volleyball Png
- Line Metro Illustration Png
- Line Design Png