DroidDia prime
.jpg "droiddia prime")
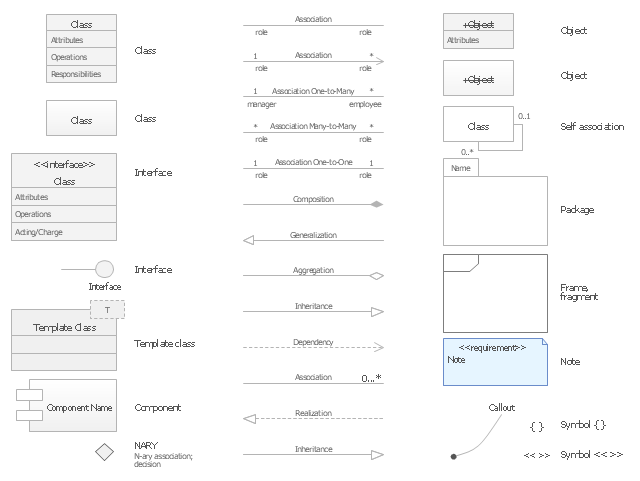
The vector stencils library "UML class diagrams" contains 38 symbols for the ConceptDraw PRO diagramming and vector drawing software.
"... classes are represented with boxes which contain three parts:
(1) The top part contains the name of the class. It is printed in Bold, centered and the first letter capitalized.
(2) The middle part contains the attributes of the class. They are left aligned and the first letter is lower case.
(3) The bottom part gives the methods or operations the class can take or undertake. They are also left aligned and the first letter is lower case. ...
To indicate a classifier scope for a member, its name must be underlined. ...
An association can be named, and the ends of an association can be adorned with role names, ownership indicators, multiplicity, visibility, and other properties. ...
Aggregation ... is graphically represented as a hollow diamond shape on the containing class end of the tree with a single line that connects the contained class to the containing class.
... graphical representation of a composition relationship is a filled diamond shape on the containing class end of the tree of lines that connect contained class(es) to the containing class.
... graphical representation of a Generalization is a hollow triangle shape on the superclass end of the line (or tree of lines) that connects it to one or more subtypes.
... graphical representation of a Realization is a hollow triangle shape on the interface end of the dashed line (or tree of lines) that connects it to one or more implementers. A plain arrow head is used on the interface end of the dashed line that connects it to its users.
Multiplicity ... representation of an association is a line with an optional arrowhead indicating the role of the object(s) in the relationship, and an optional notation at each end indicating the multiplicity of instances of that entity (the number of objects that participate in the association).
Entity classes ... are drawn as circles with a short line attached to the bottom of the circle. Alternatively, they can be drawn as normal classes with the «entity» stereotype notation above the class name." [Class diagram. Wikipedia]
The example "Design elements - UML class diagrams" is included in the Rapid UML solution from the Software Development area of ConceptDraw Solution Park.
UML class diagram symbols
"A chart can take a large variety of forms, however there are common features that provide the chart with its ability to extract meaning from data.
Typically the data in a chart is represented graphically, since humans are generally able to infer meaning from pictures quicker than from text. Text is generally used only to annotate the data.
One of the more important uses of text in a graph is the title. A graph's title usually appears above the main graphic and provides a succinct description of what the data in the graph refers to.
Dimensions in the data are often displayed on axes. If a horizontal and a vertical axis are used, they are usually referred to as the x-axis and y-axis respectively. Each axis will have a scale, denoted by periodic graduations and usually accompanied by numerical or categorical indications. Each axis will typically also have a label displayed outside or beside it, briefly describing the dimension represented. If the scale is numerical, the label will often be suffixed with the unit of that scale in parentheses. ...
Within the graph a grid of lines may appear to aid in the visual alignment of data. The grid can be enhanced by visually emphasizing the lines at regular or significant graduations. The emphasized lines are then called major grid lines and the remainder are minor grid lines.
The data of a chart can appear in all manner of formats, and may include individual textual labels describing the datum associated with the indicated position in the chart. The data may appear as dots or shapes, connected or unconnected, and in any combination of colors and patterns. Inferences or points of interest can be overlaid directly on the graph to further aid information extraction.
When the data appearing in a chart contains multiple variables, the chart may include a legend (also known as a key). A legend contains a list of the variables appearing in the chart and an example of their appearance. This information allows the data from each variable to be identified in the chart." [Chart. Wikipedia]
The vector stencils library "Time series charts" contains 10 templates: 3 column charts, 3 bar charts, 2 line graphs and 2 dot plots. All these charts are Live Objects displaying the data from external data source files.
Use these chart templates to design your business performance digital dashboards using the ConceptDraw PRO diagramming and vector drawing software.
The example "Design elements - Time series charts" is included in the Time Series Dashboard solution from the area "What is a Dashboard" of ConceptDraw Solution Park.
Time series charts

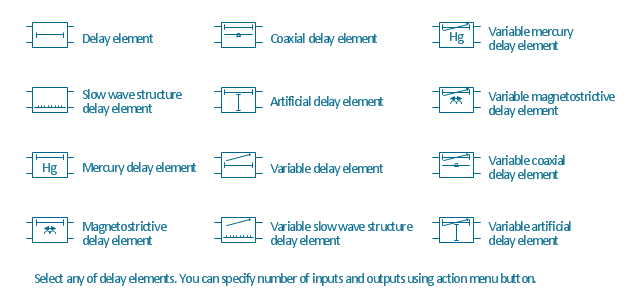
The vector stencils library "Delay elements" contains 12 symbols of delay elements for drawing electrical schematics and electronic circuit diagrams.
"An analog delay line is a network of electrical components connected in series, where each individual element creates a time difference or phase change between its input signal and its output signal. It operates on analog signals whose amplitude varies continuously. An example is a bucket-brigade device. Other types of delay line include acoustic, magnetostrictive, and surface acoustic wave devices. A series of RC networks can be cascaded to form a delay. A long transmission line can also provide a delay element. The delay time of an analog delay line may be only a few nanoseconds or several milliseconds, limited by the practical size of the physical medium used to delay the signal and the propagation speed of impulses in the medium." [Analog delay line. Wikipedia]
The symbols example "Design elements - Delay elements" was drawn using the ConceptDraw PRO diagramming and vector drawing software extended with the Electrical Engineering solution from the Engineering area of ConceptDraw Solution Park.
Delay element symbols
- Design elements - Management title blocks | Design elements ...
- Labels Lines Png
- Colorful Paper Lines Png
- Line Chart Icon Png
- Black Line Png
- Simple Baseball Field – Sample | Design a Soccer (Football) Field ...
- Png Lighting Single Line Effect
- Line White Vector Png
- Vertical White Line Transparent Png
- Curve Decoration Lines Png
- Nat Icon Png
- Mathematical Diagrams Png
- Goal Line Formation (Offense/Defense) Diagram | Association ...
- Soccer Field Png
- Free Throw Line Png
- Png Rectangle Designs
- Android Battery Logo Png
- Flowchart design . Flowchart symbols, shapes, stencils and icons ...
- Beetles in the river Thames | | Design elements - Geography ...
- Straight Line Png