The vector stencils library "Lamps, acoustics, measuring instruments" contains 35 element symbols of lamps, acoustic components, electrical measuring instruments.
Use these shapes for drawing electrical schematics and electronic circuit diagrams in the ConceptDraw PRO diagramming and vector drawing software extended with the Electrical Engineering solution from the Engineering area of ConceptDraw Solution Park.
www.conceptdraw.com/ solution-park/ engineering-electrical
Ammeter

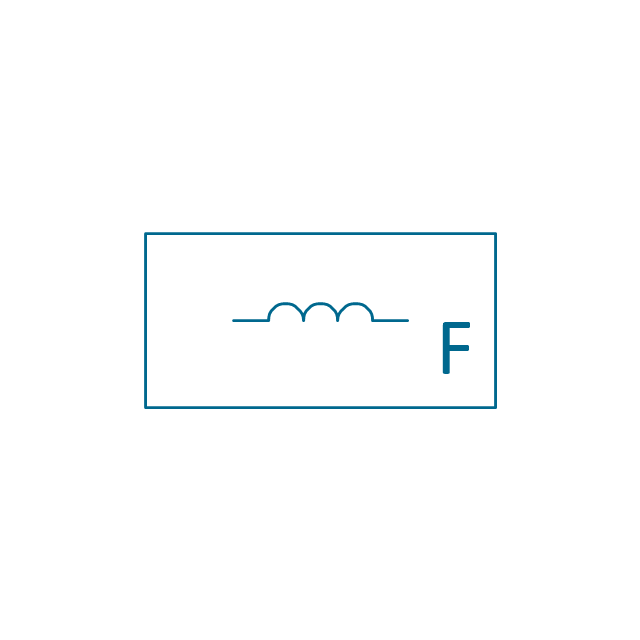
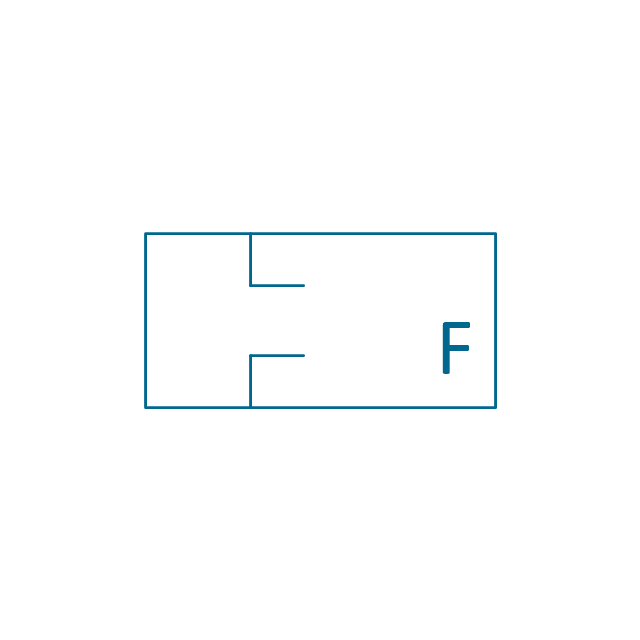
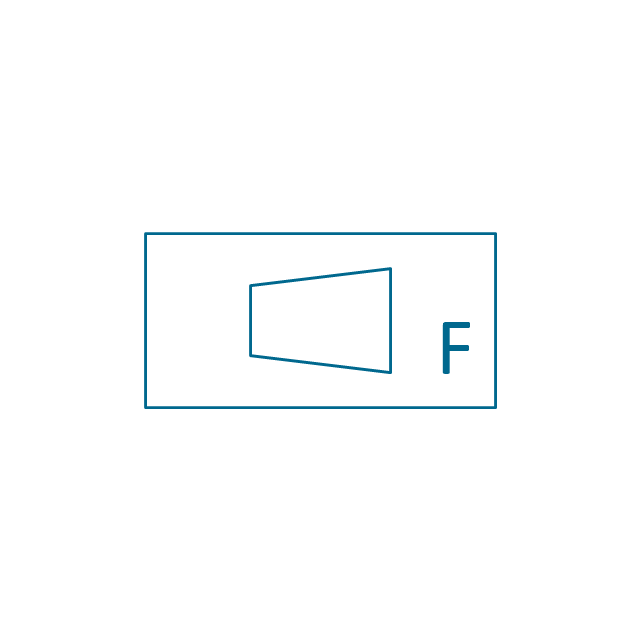
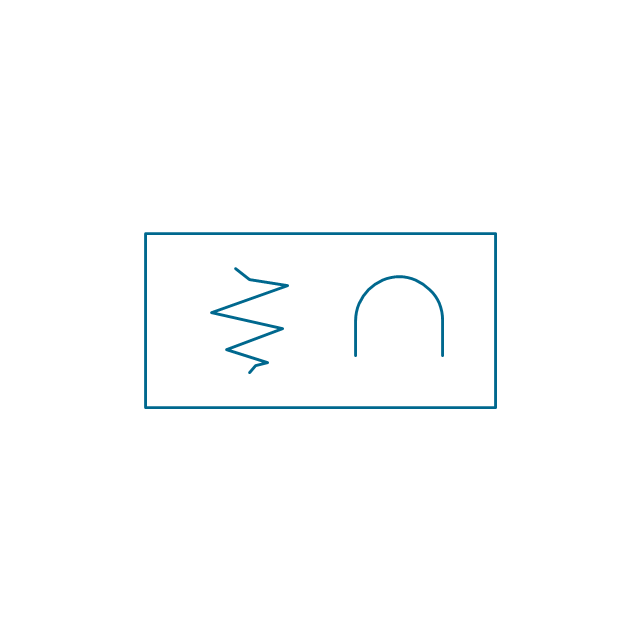
Frequency meter

Voltmeter

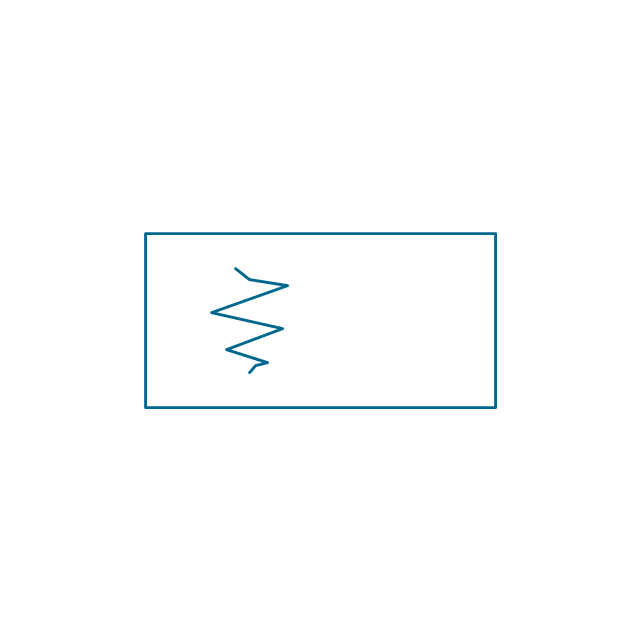
Galvanometer
Oscilloscope

Synchroscope

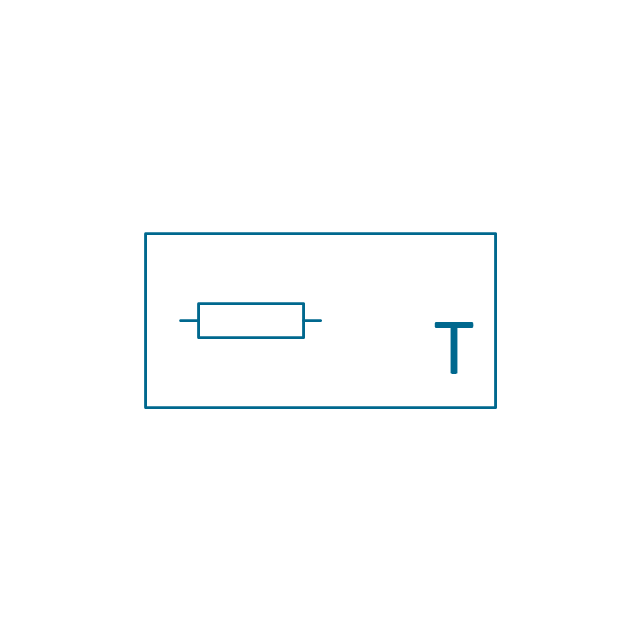
Thermometer

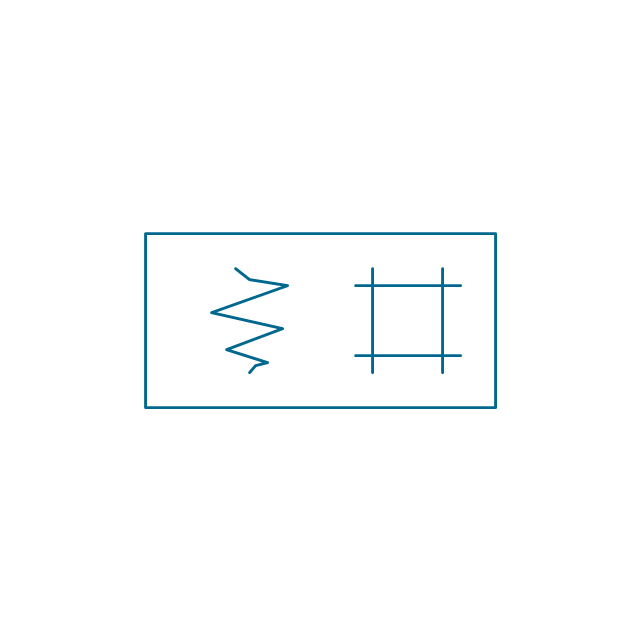
Wavemeter

Standard bell with 1 line input
Single-stroke bell with 1 line input
Siren with 1 line input
Standard bell with 2 lines input
Bell with 2 lines input
Bell with 1 line input
Single-stroke bell with 2 lines input
Siren with 2 lines input
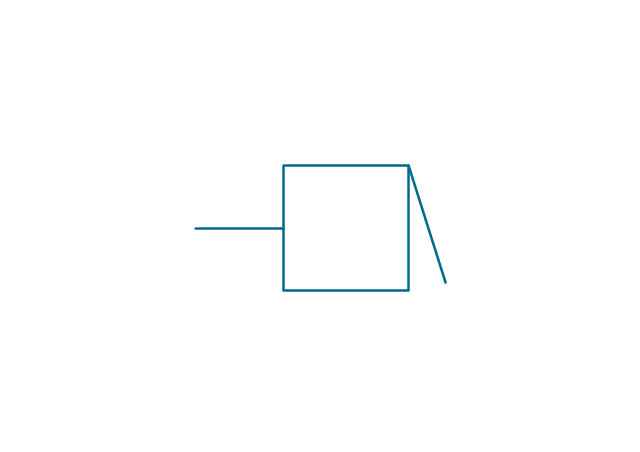
Buzzer with 1 line input
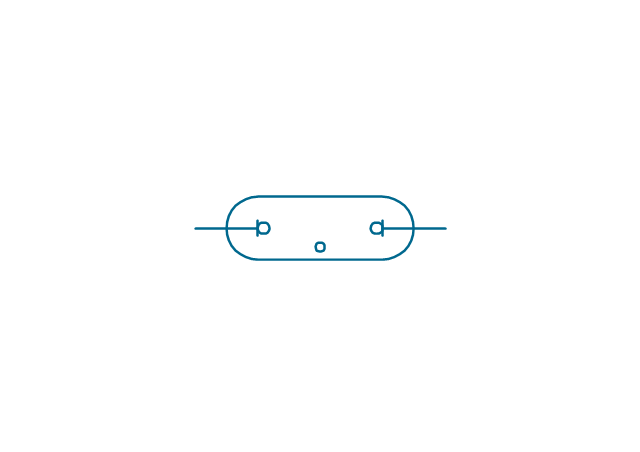
Buzzer with 2 lines input
Buzzer with 2 lines input
Buzzer with 1 line input
Indicating lamp with 1 line input

Non-indicating lamp with 1 line input

Indicating lamp with 2 lines input

Non-indicating lamp with 2 lines input

Signal lamp

Lamp

Fluorescent lamp 2 terminal
Fluorescent lamp 4 terminal
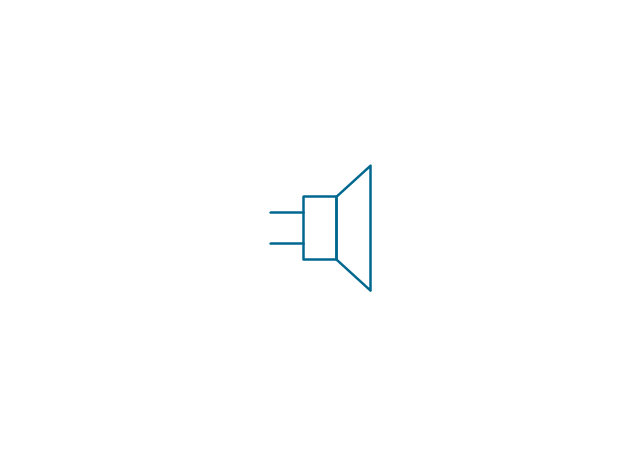
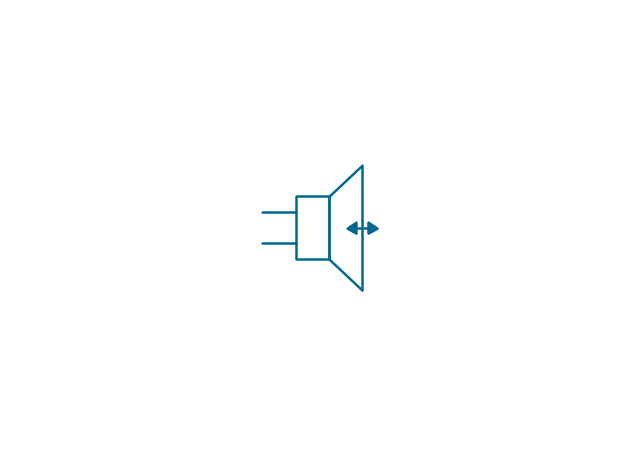
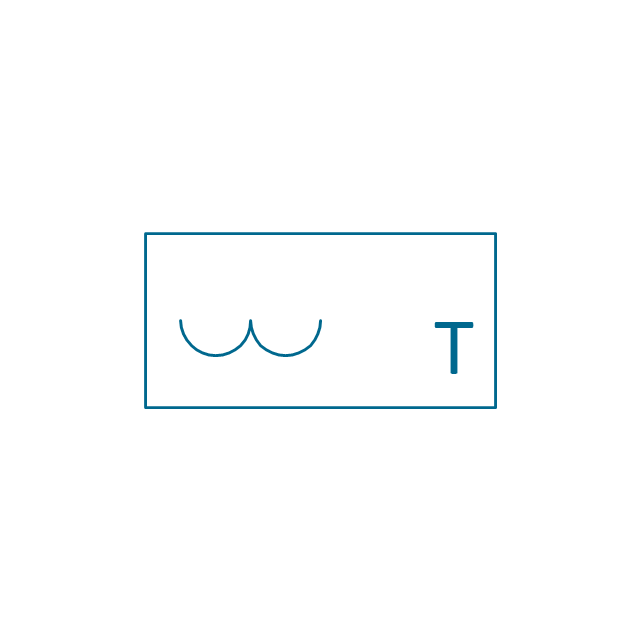
Speaker
Speaker with microphone
Microphone

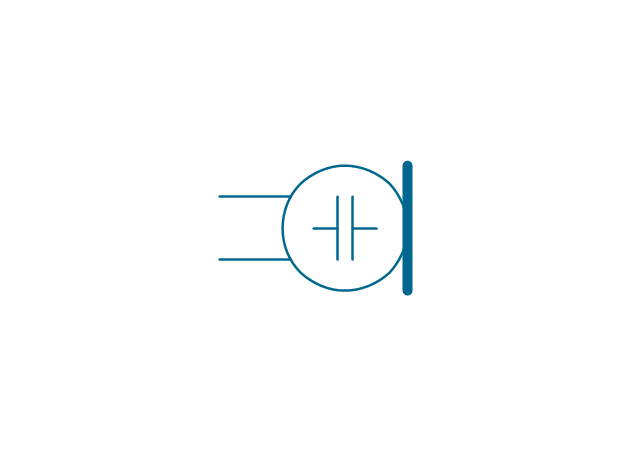
Capacitor microphone
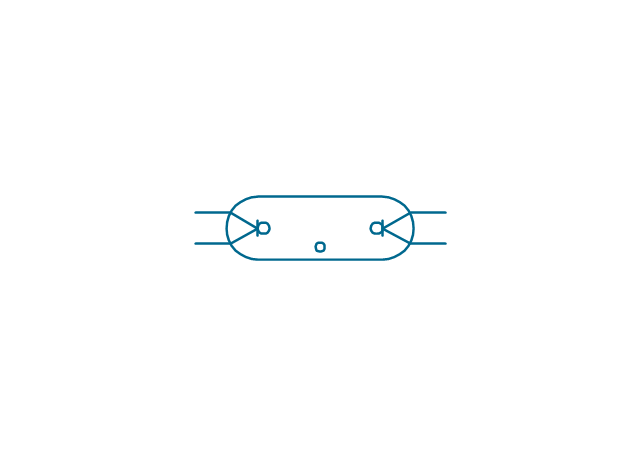
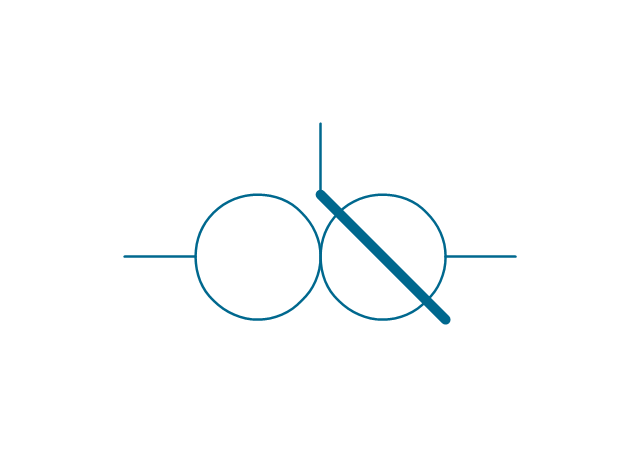
Push-pull microphone
Microphone with 1 line
Microphone with 2 lines

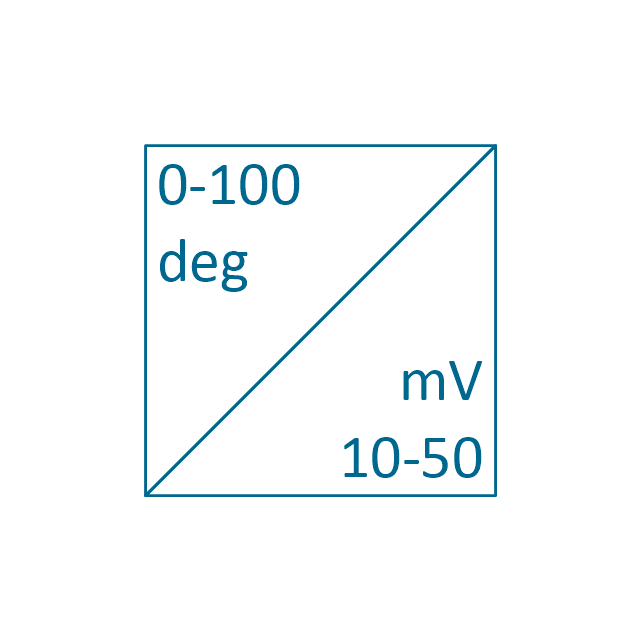
Relative Value Chart Software

Electrical Symbols, Electrical Diagram Symbols

The vector stencils library "Instruments" contains 72 symbols of control instruments and measuring devices: meters and gauges, and callouts, text boxes, and inserts.
Use these shapes to create annotated process flow diagrams (PFD), flow control, manufacturing processes, and distribution system diagrams in the ConceptDraw PRO software extended with the Chemical and Process Engineering solution from the Chemical and Process Engineering area of ConceptDraw Solution Park.
www.conceptdraw.com/ solution-park/ engineering-chemical-process
Indicator local

Indicator remote
Indicator auxiliary
CRT local

CRT remote
CRT auxiliary
PLC local

PLC auxiliary

PLC remote

Computer local

Computer auxiliary

Computer remote

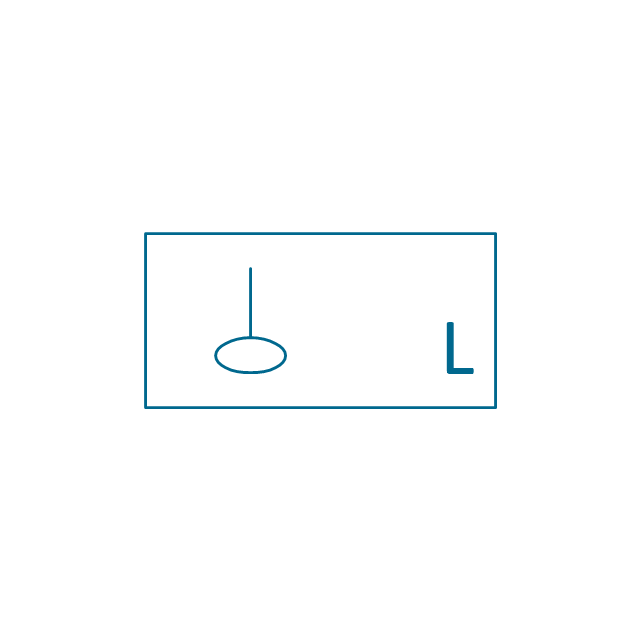
Light local

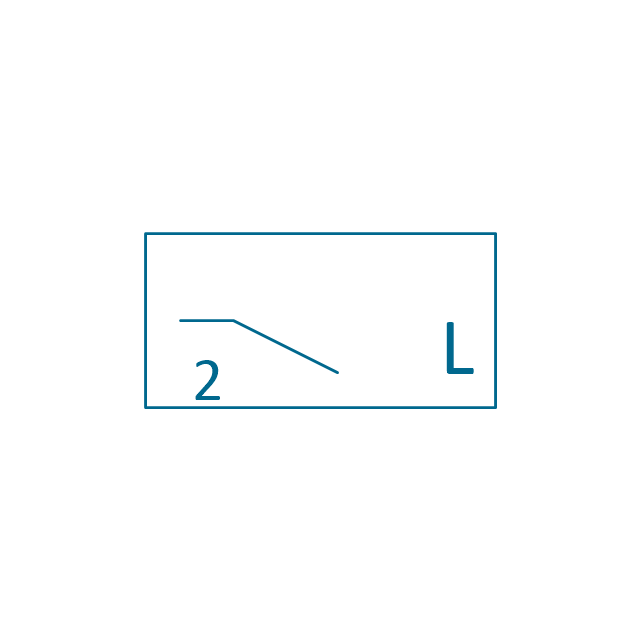
Light remote
Light auxiliary
Indicator auxiliary (dashed)
-instruments---vector-stencils-library.png--diagram-flowchart-example.png)
Indicator remote (dashed)
-instruments---vector-stencils-library.png--diagram-flowchart-example.png)
Steam traced auxiliary

Steam traced remote

Steam traced local

Level meter auxiliary
Level meter remote
Level meter local
Pressure gauge diaphragm
Pressure gauge

Pressure gauge liquid filled
Strain gauge
Thermometer bi-metallic

Thermometer gas

Thermometer general

Thermometer glass

Thermometer liquid
Thermometer resistance
Thermometer thermocouple

Flowmeter electromagnetic
Flowmeter general

Flowmeter nozzle
Flowmeter orifice

Flowmeter positive displacement

Flowmeter turbine

Flowmeter variable area
Flowmeter Venturi

Level meter capacitive

Level meter conductive
Level meter displacer

Level meter float
Level meter general

Level meter sonic

Indicator analoque

Indicator digital
Indicator general

Recorder analoque
Recorder digital
Recorder general
Converter
Converter 2 (1st half filled)
-instruments---vector-stencils-library.png--diagram-flowchart-example.png)
Converter 3 (2nd half filled)
-instruments---vector-stencils-library.png--diagram-flowchart-example.png)
Venturi

Venturi (pressure taps)
-instruments---vector-stencils-library.png--diagram-flowchart-example.png)
Flowmeter

Rotameter
Vortex sensor

Propeller meter

Generic utility

Operator box

Operator box 2 (1st half filled)
-instruments---vector-stencils-library.png--diagram-flowchart-example.png)
Operator box 3 (2nd half filled)
-instruments---vector-stencils-library.png--diagram-flowchart-example.png)
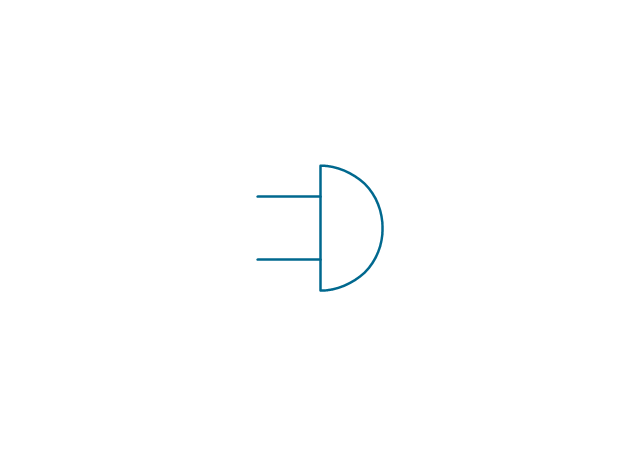
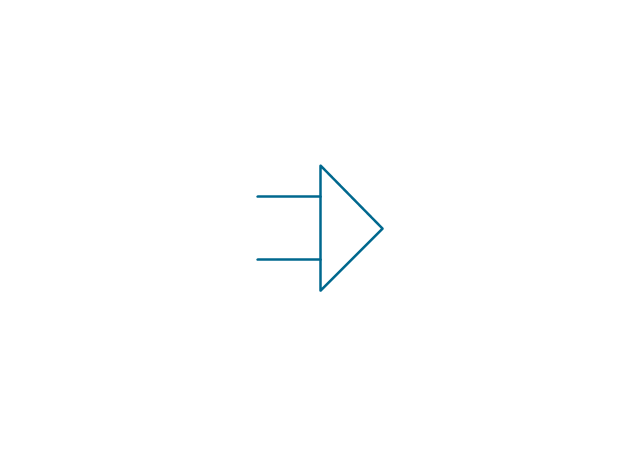
AND gate

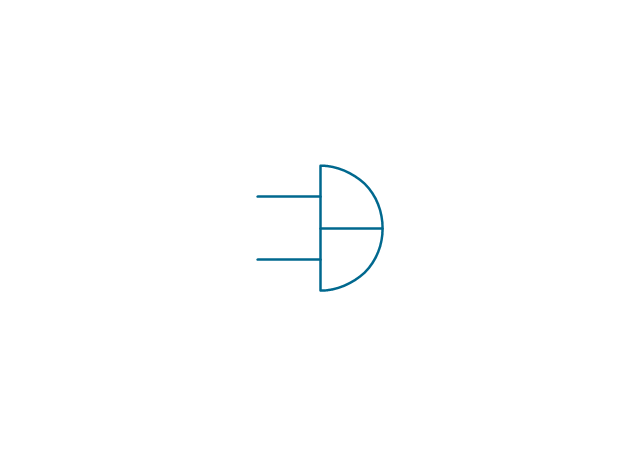
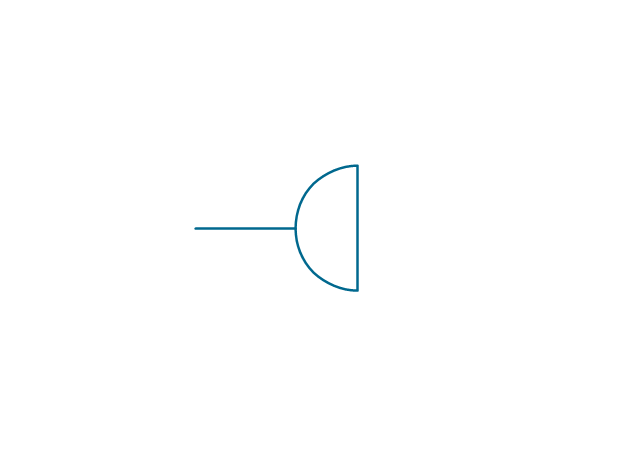
OR gate

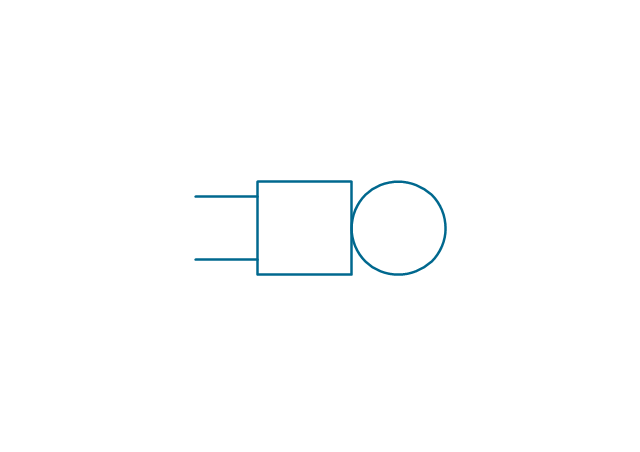
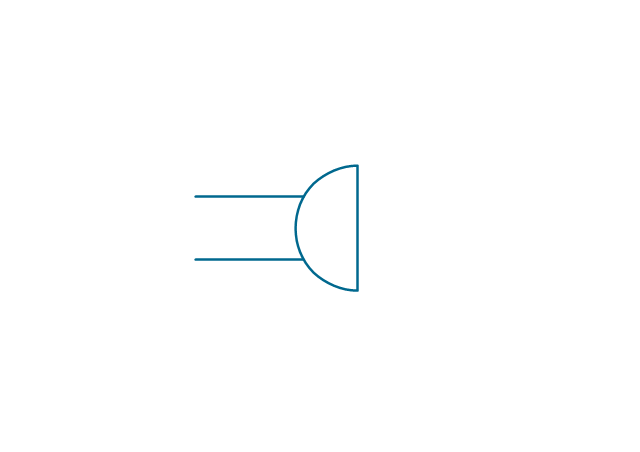
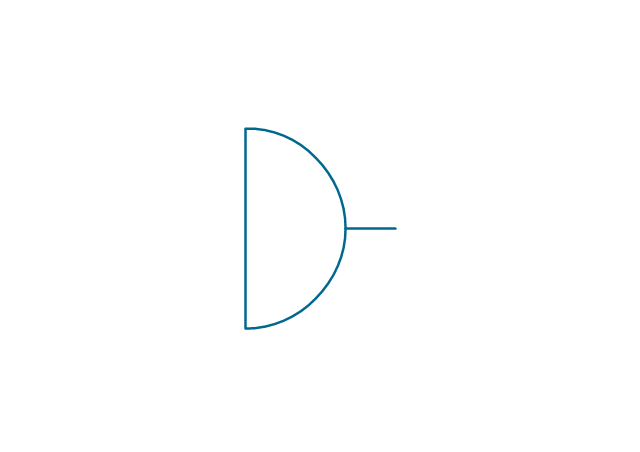
NOT gate

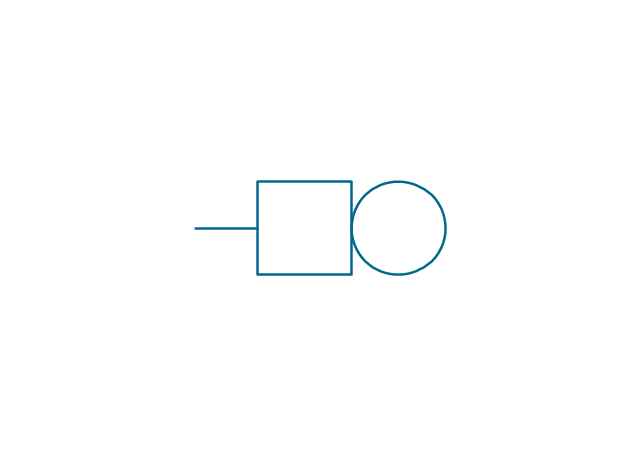
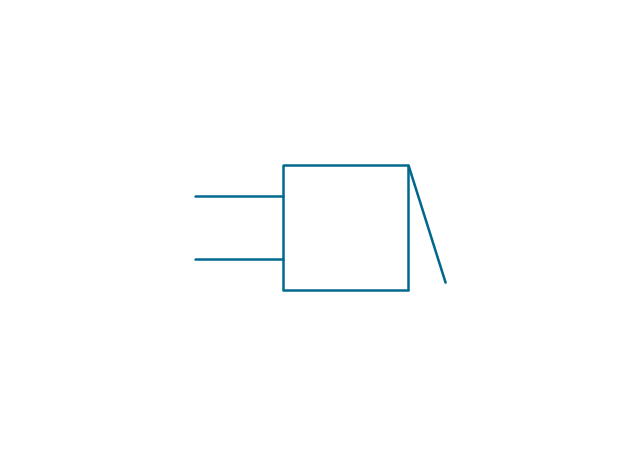
Correcting element

Diamond

Percentage Pie Chart. Pie Chart Examples

Rainfall Bar Chart

Building Drawing Software for Design Office Layout Plan


Bar Diagrams for Problem Solving. Create event management bar charts with Bar Graphs Solution

BCG Matrix

Feature Comparison Chart Software

- Lamps, acoustics, measuring instruments - Vector stencils library ...
- Electrical Diagram Symbols | Lamps, acoustics, measuring ...
- Lamps, acoustics, measuring instruments - Vector stencils library ...
- Measuring Instrument Diagrams
- Different Electrical Measuring Devices Diagram
- Diagrams Of Electronics Measuring Equipment
- Design elements - Lamps, acoustics, measuring instruments ...
- Lamps, acoustics, measuring instruments - Vector stencils library ...
- Design elements - Lamps, acoustics, measuring instruments ...
- How to Set Line Jumps for Smart Connectors in ConceptDraw PRO ...
- Electrical Instruments Diagrams
- Design elements - Lamps, acoustics, measuring instruments | Video ...
- Electrical Instrument Drawing
- Software For Drawing Electrical Instruments
- Design elements - Instruments | Piping and Instrumentation Diagram ...
- Electrical Symbols, Electrical Diagram Symbols | Electrical Drawing ...
- Design elements - Lamps, acoustics, measuring instruments | How ...
- Electrical Symbols For Electrical Instruments
- Electrical Symbols For Electrical Measurements
- Design elements - Lamps, acoustics, measuring instruments ...