This arrow ring diagram sample was created on the base of the figure illustrating the webpage "Grant Life Cycle" from the Georgia College website. "Grant Life Cycle.
Define Opportunity: Funding opportunities can come from anywhere: databases, agency websites, professional publications or colleagues. GC subscribes to the database GRC. Federal grant opportunities can be found through Grants.gov.
Develop Proposal: Once an opportunity has been identified OGSP will do the following:
(1) Review the announcement for application requirements.
(2) Meet with the Principal Investigator (PI) to develop a project management plan.
(3) Work up a draft budget for PI approval.
(4) Complete the sponsor/ required forms and budget justification to be included in the application.
Submit & Negotiate: Applications can only be submitted by GC or the GC Foundation. Once internal approval has been received, designated staff in the appropriate office will submit the application on behalf of the PI and institution. If awarded, the GC or Foundation personnel will review and negotiate acceptable terms and conditions to GC, GC Fdn and/ or USG.
All of these are part of Pre-award services. ...
Award Setup: OGSP will review award documentation and assist all responsible parties with their roles and responsibilities during the grant. OGSP is available through the life of the award to provide support with any non-financial issues.
Manage Subawards: If subawards were identified at application, OGSP will issue the subaward using GC approved forms. If the need for a portion of the work to be completed by an outside entity is noted in the post-award phase, the Grants Compliance Manager will secure agency approval and then issue the subaward. OGSP will monitor the fiscal aspects of the subaward while the PI is responsible for the programmatic compliance.
Execute Project: OGSP continually monitors each grant for compliance with award terms & conditions. As legal representative, OGSP works with the PI and funder to expedite reports and resolve any issues that might arise.
Close Out Project: Once a grant has reached the end of the project period, all funders have requirements for final progress and financial reports. OGSP will work with the PI to make sure the progress report is submitted in a timely fashion and the Business & Finance completes the final invoices or report. The storage of the official project file is the responsibility of OGSP. All information and reports should be copied to the Grant Compliance Manager for inclusion in the official record." [gcsu.edu/ grants/ grantlifecycle.htm]
The arrow ring diagram example "Grant life cycle" was created using the ConceptDraw PRO diagramming and vector drawing software extended with the Target and Circular Diagrams solution from the Marketing area of ConceptDraw Solution Park.
www.conceptdraw.com/ solution-park/ marketing-target-and-circular-diagrams
Arrow ring diagram
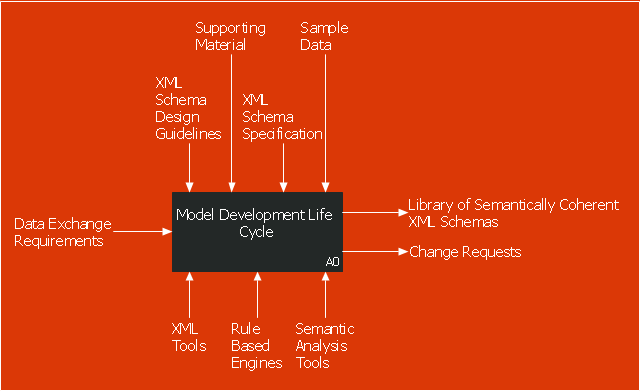
This IDEF0 diagram sample was created on the base of the figure from the website of the Engineering Laboratory of the National Institute of Standards and Technology (NIST). [mel.nist.gov/ msidlibrary/ doc/ kc_ morris/ gsa-final_ files/ image002.gif]
"The systems development life cycle (SDLC), also referred to as the application development life-cycle, is a term used in systems engineering, information systems and software engineering to describe a process for planning, creating, testing, and deploying an information system. The systems development life-cycle concept applies to a range of hardware and software configurations, as a system can be composed of hardware only, software only, or a combination of both." [Systems development life cycle. Wikipedia]
The IDEF0 diagram example "Model development life cycle" was created using the ConceptDraw PRO diagramming and vector drawing software extended with the IDEF0 Diagrams solution from the Software Development area of ConceptDraw Solution Park.
IDEF0 diagram
This arrow loop cycle diagram sample was created on the base of the figure illustrating the webpage "Exploratory Advanced Research Program Hand-Off Workshops" from the US Department of Transportation - Federal Highway Administration (FHWA) website. "The FHWA’s research and technology innovation life cycle illustrates that research and technology development are not insular activities, but integrated processes that together constitute a system.
Following general workshop discussion, a number of common issues emerged among the groups. These centered around the research life cycle, communicating the value of exploratory advanced research, and continued project funding. It was felt that there is a general need to better describe the research and deployment cycle specific to highway transportation and possibly to highway research fields, such as materials or system planning. Research life cycle diagrams show a very linear, chronological process but it is not necessarily that way in reality." [fhwa.dot.gov/ advancedresearch/ pubs/ 11034/ ]
The arrow loop diagram example "Innovation life cycle" was created using the ConceptDraw PRO diagramming and vector drawing software extended with the Target and Circular Diagrams solution from the Marketing area of ConceptDraw Solution Park.
www.conceptdraw.com/ solution-park/ marketing-target-and-circular-diagrams
Arrow loop cycle diagram
 Target and Circular Diagrams
This solution extends ConceptDraw DIAGRAM software with samples, templates and library of design elements for drawing the Target and Circular Diagrams.
This circular motion diagram sample was created on the base of the figure illustrating the article "Collaboration 2.0" from the HLWIKI International website. "Collaboration is an activity where individuals are motivated to work together in order to achieve certain mutually-desirable, articulated and achievable goals. In the digital age, collaboration 2.0 combines various aspects of web 2.0 and social media with the principles of collaboration. Some critical or typical features of collaboration 2.0 should include:
(1) synchronous collaboration via social calendaring, online meeting software and instant messaging tools,
(2) asynchronous collaboration made possible via shared workspaces and annotation capabilities.
A new form of collaboration is called collaborative information seeking which Wikipedia defines as "... a field of research that involves studying situations, motivations, and methods for people working in collaborative groups for information seeking projects, as well as building systems for supporting such activities. Such projects often involve information searching or information retrieval (IR), information gathering, and information sharing. Beyond that, CIS can extend to collaborative information synthesis and collaborative sense-making." " [hlwiki.slais.ubc.ca/ index.php/ Collaboration_ 2.0]
This file is available under a Creative Commons Attribution-NonCommercial-ShareAlike 2.5 Generic Licence. [creativecommons.org/ licenses/ by-nc-sa/ 2.5/ ]
The circular arrow diagram example "Collaboration life-cycle" was created using the ConceptDraw PRO diagramming and vector drawing software extended with the Target and Circular Diagrams solution from the Marketing area of ConceptDraw Solution Park.
www.conceptdraw.com/ solution-park/ marketing-target-and-circular-diagrams
Circular motion diagram
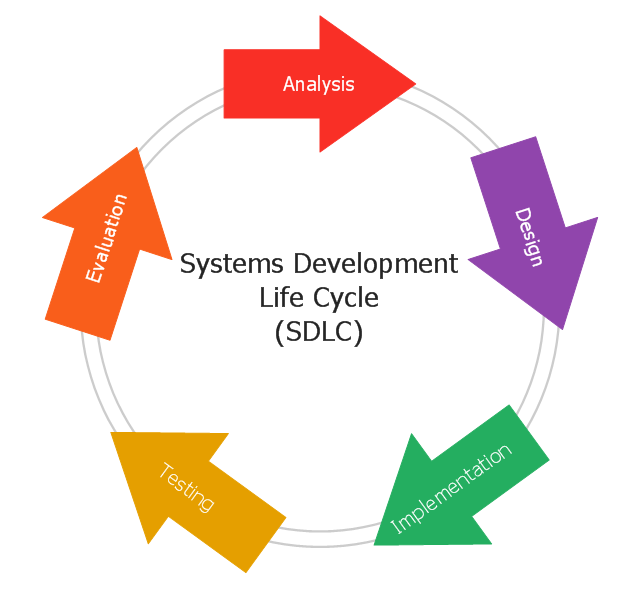
This circular arrows diagram sample shows the systems development life cycle (SDLC) stages.
"The systems development life cycle (SDLC), also referred to as the application development life-cycle, is a term used in systems engineering, information systems and software engineering to describe a process for planning, creating, testing, and deploying an information system. The systems development life-cycle concept applies to a range of hardware and software configurations, as a system can be composed of hardware only, software only, or a combination of both." [Systems development life-cycle. Wikipedia]
The arrow circle diagram example "Systems development life cycle" was created using the ConceptDraw PRO diagramming and vector drawing software extended with the Circular Arrows Diagrams solution from the area "What is a Diagram" of ConceptDraw Solution Park.
Circular arrows diagram

This circular arrows diagram sample shows business process management life cycle.
It was designed on the base of the Wikimedia Commons file: Business Process Management Life-Cycle.svg. [commons.wikimedia.org/ wiki/ File:Business_ Process_ Management_ Life-Cycle.svg]
This file is licensed under the Creative Commons Attribution-Share Alike 3.0 Unported license. [creativecommons.org/ licenses/ by-sa/ 3.0/ deed.en]
"BPM life-cycle.
Business process management activities can be grouped into six categories: vision, design, modeling, execution, monitoring, and optimization.
Functions are designed around the strategic vision and goals of an organization. Each function is attached with a list of processes. Each functional head in an organization is responsible for certain sets of processes made up of tasks which are to be executed and reported as planned. Multiple processes are aggregated to function accomplishments and multiple functions are aggregated to achieve organizational goals." [Business process management. Wikipedia]
The arrow donut chart example "BPM life cycle" was created using the ConceptDraw PRO diagramming and vector drawing software extended with the Circular Arrows Diagrams solution from the area "What is a Diagram" of ConceptDraw Solution Park.
Circular arrows diagram

This circular arrows diagram sample shows the innovation life cycle stages. It was designed on the base of the from the website of the Federal Highway Administration (FHWA) of the U.S. Department of Transportation (DOT). [fhwa.dot.gov/ advancedresearch/ pubs/ 11034/ ]
"Innovation is defined simply as a "new idea, device, or method". However, innovation is often also viewed as the application of better solutions that meet new requirements, unarticulated needs, or existing market needs. This is accomplished through more-effective products, processes, services, technologies, or business models that are readily available to markets, governments and society." [Innovation. Wikipedia]
The diagram example "Innovation life cycle" was created using the ConceptDraw PRO diagramming and vector drawing software extended with the Circular Arrows Diagrams solution from the area "What is a Diagram" of ConceptDraw Solution Park.
Circular arrows diagram
This IDEF0 diagram sample was created on the base of the figure from the website of the Engineering Laboratory of the National Institute of Standards and Technology (NIST). [mel.nist.gov/ msidlibrary/ doc/ kc_ morris/ gsa-final_ files/ image002.gif]
"The systems development life cycle (SDLC), also referred to as the application development life-cycle, is a term used in systems engineering, information systems and software engineering to describe a process for planning, creating, testing, and deploying an information system. The systems development life-cycle concept applies to a range of hardware and software configurations, as a system can be composed of hardware only, software only, or a combination of both." [Systems development life cycle. Wikipedia]
The IDEF0 diagram example "Model development life cycle" was created using the ConceptDraw PRO diagramming and vector drawing software extended with the IDEF0 Diagrams solution from the Software Development area of ConceptDraw Solution Park.
"The systems development life cycle (SDLC), also referred to as the application development life-cycle, is a term used in systems engineering, information systems and software engineering to describe a process for planning, creating, testing, and deploying an information system. The systems development life-cycle concept applies to a range of hardware and software configurations, as a system can be composed of hardware only, software only, or a combination of both." [Systems development life cycle. Wikipedia]
The IDEF0 diagram example "Model development life cycle" was created using the ConceptDraw PRO diagramming and vector drawing software extended with the IDEF0 Diagrams solution from the Software Development area of ConceptDraw Solution Park.
IDEF0 diagram
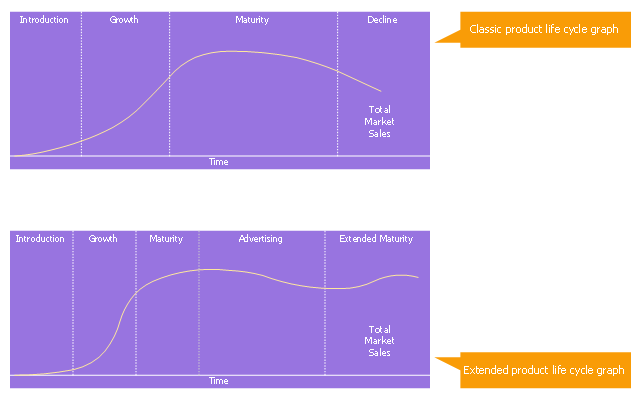
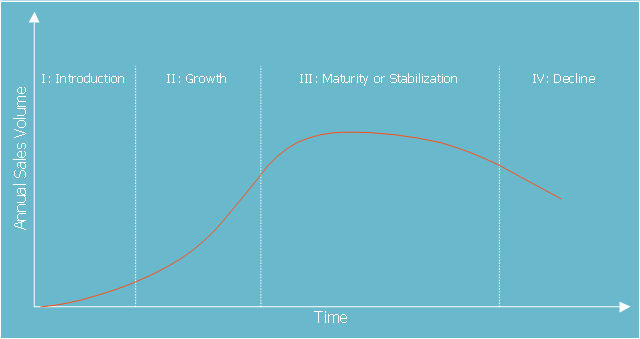
This is product lifecycle graph (PLC) diagram template.
Use it to design your product lifecycle graphs with ConceptDraw PRO software.
PLC graph visualizes a new product progress through a sequence of stages from introduction to Growth, Maturity, and Decline. This sequence is associated with changes in the marketing situation, thus impacting the marketing strategy and the marketing mix. The product revenue and profits can also be plotted as a function of the PLC stages.
The marketing chart template "Product life cycle graph" is included in the Marketing Diagrams solution from the Marketing area of ConceptDraw Solution Park.
Marketing graph template
Program to Make Flow Chart

This circular arrows diagram sample shows the systems development life cycle (SDLC) stages.
"The systems development life cycle (SDLC), also referred to as the application development life-cycle, is a term used in systems engineering, information systems and software engineering to describe a process for planning, creating, testing, and deploying an information system. The systems development life-cycle concept applies to a range of hardware and software configurations, as a system can be composed of hardware only, software only, or a combination of both." [Systems development life-cycle. Wikipedia]
The arrow circle diagram example "Systems development life cycle" was created using the ConceptDraw DIAGRAM diagramming and vector drawing software extended with Business Diagrams solution from Management area of ConceptDraw Solution Park.
Circular arrows diagram
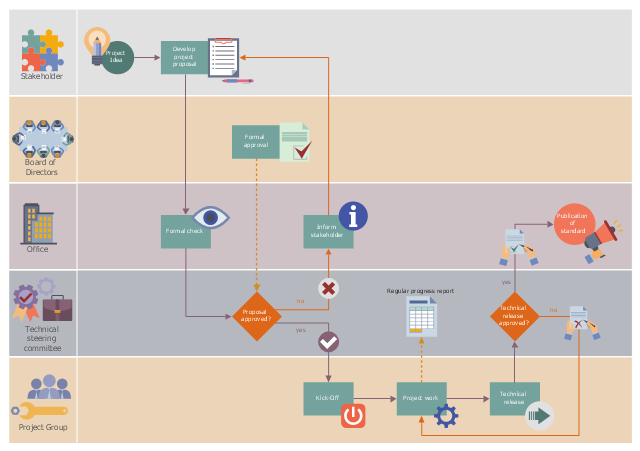
This workflow diagram example was designed on the base of the Wikimedia Commons file: ASAM e.V. flowchart.png.
"Life cycle of an ASAM standard." [commons.wikimedia.org/ wiki/ File:ASAM_ e.V._ flowchart.png]
This file is licensed under the Creative Commons Attribution-Share Alike 3.0 Unported license. [creativecommons.org/ licenses/ by-sa/ 3.0/ deed.en]
"Association for Standardization of Automation and Measuring Systems or ASAM is an incorporated association under German law. Its members are primarily international car manufacturers, suppliers and engineering service providers from the automotive industry. The association coordinates the development of technical standards, which are developed by working groups composed of experts from its member companies. ASAM pursues the vision that the tools of a development process chain can be freely interconnected and allow a seamless exchange of data. The standards define protocols, data models, file formats and application programming interfaces (APIs) for the use in the development and testing of automotive electronic control units." [Association for Standardisation of Automation and Measuring Systems. Wikipedia]
The workflow diagram example "Life cycle of an ASAM standard" was created using ConceptDraw PRO software extended with the Business Process Workflow Diagrams solution from the Business Processes area of ConceptDraw Solution Park.
Workflow diagram
Use the Best FlowChart Tool for the Job

Draw Flowcharts with ConceptDraw

The vector stencils library "Marketing diagrams" contains 12 templates of marketing and sales diagrams and charts. Use it to illustrate your marketing and sales documents, presentations, infographics and webpages in ConceptDraw PRO software extended with Marketing Diagrams solution from Marketing area of ConceptDraw Solution Park.
Diffusion of Innovations

Normal distribution

Five forces model

Leaky bucket diagram

Funnel diagram

Relationship ladder of customer loyalty

Six markets model

Product life cycle graph

Extended product life cycle graph

Service-goods continuum diagram

Step chart block

Step diagram block

The vector stencils library "Marketing diagrams" contains 12 templates of marketing and sales diagrams and charts. Use it to illustrate your marketing and sales documents, presentations, infographics and webpages in ConceptDraw PRO software extended with Marketing Diagrams solution from Marketing area of ConceptDraw Solution Park.
Diffusion of Innovations
Normal distribution
Five forces model
Leaky bucket diagram
Funnel diagram
Relationship ladder of customer loyalty
Six markets model
Product life cycle graph
Extended product life cycle graph
Service-goods continuum diagram
Step chart block
Step diagram block
Metropolitan area networks (MAN). Computer and Network Examples
. Computer and Network Examples")

This marketing chart sample represents product life cycle. It was designed on the base of the Wikimedia Commons file: Product life-cycle curve.jpg. [commons.wikimedia.org/ wiki/ File:Product_ life-cycle_ curve.jpg]
This file is licensed under the Creative Commons Attribution-Share Alike 4.0 International license. [creativecommons.org/ licenses/ by-sa/ 4.0/ deed.en]
The marketing chart example "Product life cycle graph" was created using the ConceptDraw PRO diagramming and vector drawing software extended with the Marketing Diagrams solution from the Marketing area of ConceptDraw Solution Park.
Marketing chart
This cycle diagram sample was created on the base of the figure illustrating the article "Environmental Materials" by Cris Arnold from the website of the UK Centre for Materials Education of the Higher Education Academy. "The figure ... schematically shows how the disparate areas under the heading of 'environmental materials' can be linked via a life cycle analysis approach. ...
Life Cycle Analysis.
Life Cycle Analysis is essentially a method of considering the entire environmental impact, energy and resource usage of a material or product. It is often known as a 'cradle-to-grave' analysis and can encompass the entire lifetime from extraction to end-of-life disposal. Life cycle analysis can be an extremely effective way of linking many different aspects of the environmental impacts of materials usage. ...
Materials Extraction and Resource Implications.
The environmental impact of raw materials extraction and processing together with global resource issues provides a good place to start consideration of environmental aspects of materials. ...
Environmental Impacts of Processing.
... Topics that would come under this subject area include the specific environmental problems associated with processing of metals, polymers, ceramics, composites etc, and how these problems can be overcome.
Design for Sustainability.
This area ... will ... cover issues such as design for successful recycling, waste minimisation, energy efficiency and increased lifetime.
Economic, Social and Legislative Issues.
... For example, materials selection within the automotive industry is now heavily influenced by 'end-of-life vehicle' and 'hazardous material' regulations.
Use of Sustainable Materials.
... It is probably sensible to define such materials as those that have distinct differences that achieve environmental benefit compared to conventional materials. With this definition, the list would include:
(1) Materials of a significantly plant-based nature, including wood, natural fibre composites, natural polymers.
(2) Materials produced using a large proportion of waste material, including recycled polymers, composites made from waste mineral powders, and arguably also much steel and aluminium.
Materials for Green Energy.
The most exciting developments in Materials Science are in the realm of functional materials, and many of these serve an environmentally-beneficial purpose, particularly in the production of green energy.
These include:
(1) Solar-cell materials.
(2) Fuel-cell technology.
(3) Catalytic pollution control.
End-of-Life Issues.
The treatment of materials at the end of their lifetime is a significant subject area and encompasses aspects such as recycling techniques and materials limitations, biodegradabilty and composting, chemical recovery and energy recovery." [materials.ac.uk/ guides/ environmental.asp]
The ring chart example "Life cycle analysis" was created using the ConceptDraw PRO diagramming and vector drawing software extended with the Target and Circular Diagrams solution from the Marketing area of ConceptDraw Solution Park.
www.conceptdraw.com/ solution-park/ marketing-target-and-circular-diagrams
Ring chart

- Systems development life cycle | SSADM Diagram | Process ...
- Process Flowchart | JSD | Systems development life cycle
- Systems development life cycle | SSADM Diagram | Circular Flow ...
- Product life cycle graph
- Process Flowchart | Data Flow Diagram For Life Insurance Company
- Project management life cycle - Flowchart | Product life cycle ...
- Systems development life cycle | Block Diagrams | Circular Arrows ...
- IDEF0 Visio | UML Diagram Visio | Life Cycle Diagram With Visio
- Product life cycle process - Flowchart | With The Aid Of Diagram ...
- Model development life cycle - IDEF0 diagram | Circular Arrows ...
- Systems development life cycle | DFD | Circular Arrows Diagrams
- Systems development life cycle | Circular Arrows Diagrams | Circular ...
- Systems development life cycle | Circular Arrows Diagrams | Block ...
- Life Cycle Diagram Visio
- Life Cycle Marketing Diagram
- Product life cycle graph
- Systems development life cycle - Arrow loop diagram
- Network Hubs | Network Diagram Software Topology Network ...
- Atmosphere air composition | Percentage Pie Chart. Pie Chart ...
- Draw And Label A Product Life Cycle Diagram