This flowchart example was created on the base of land sales process diagram from the Property management webpage of the VicRoads website.
[www.vicroads.vic.gov.au/ planning-and-projects/ property-services/ property-management]
"VicRoads or the Roads Corporation of Victoria is a statutory corporation which is the state road and traffic authority in the state of Victoria, Australia. It is responsible for maintenance and construction of the state arterial road network, as well as driver licensing and vehicle registration. VicRoads has broad responsibility for road safety policy and research. It is also responsible for regulating the accident towing industry in Victoria." [VicRoads. Wikipedia]
"Sales Process.
Once it has been established with the relevant VicRoads Regions/ Projects and other business areas that properties are identified as surplus to VicRoads’ operational needs, they are incorporated in the VicRoads annual sales program.
Following approval: relevant VicRoads Regional Manager and the VicRoads Chief Executive (and in some circumstances Minster for Public Transport and Roads) must approve all land deemed surplus and available for disposal.
The method of sale is then determined and consultant advice is sought:
(1) Planning.
(2) Valuer General Victoria (Valuer General’s office must provide a valuation for all sales).
(3) Government Land Monitor (Land Monitor approval is sought if the value exceeds $750,000).
(4) Environmental.
(5) Local Council." [www.vicroads.vic.gov.au/ planning-and-projects/ property-services/ property-management]
The example "Land sales process flowchart" was created using the ConceptDraw PRO diagramming and vector drawing software extended with the Sales Flowcharts solution from the Marketing area of ConceptDraw Solution Park.
Sales process chart

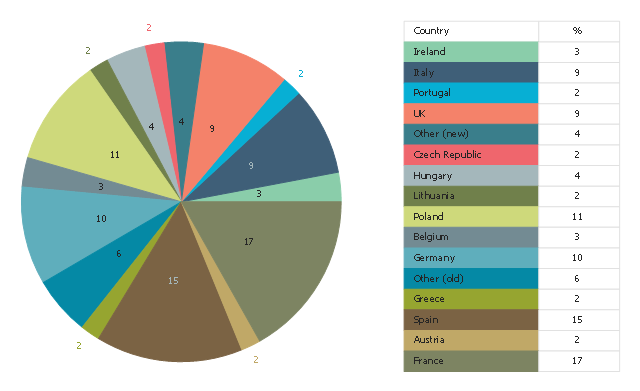
This pie chart sample shows the percentage of EU farm land by country. It was designed on the base of the Wikimedia Commons file: EUFarm-eng.svg. [commons.wikimedia.org/ wiki/ File:EUFarm-eng.svg]
"The agricultural sector is supported by subsidies from the European Union in the form of the Common Agricultural Policy (CAP). In 2013 this represented approximately €45billion (less than 33% of the overall budget of €148billion) of the EU's total spending. It was used originally to guarantee a minimum price for farmers in the EU. This is criticised as a form of protectionism, inhibiting trade, and damaging developing countries; one of the most vocal opponents is the UK, the second largest economy within the bloc, which has repeatedly refused to give up the annual UK rebate unless the CAP undergoes significant reform; France, the biggest beneficiary of the CAP and the bloc's third largest economy, is its most vocal proponent." [Economy of the European Union. Wikipedia]
The pie chart example "Percentage of EU farm land by country" was created using the ConceptDraw PRO diagramming and vector drawing software extended with the Pie Charts solutiton of the Graphs and Charts area in ConceptDraw Solution Park.
Pie chart
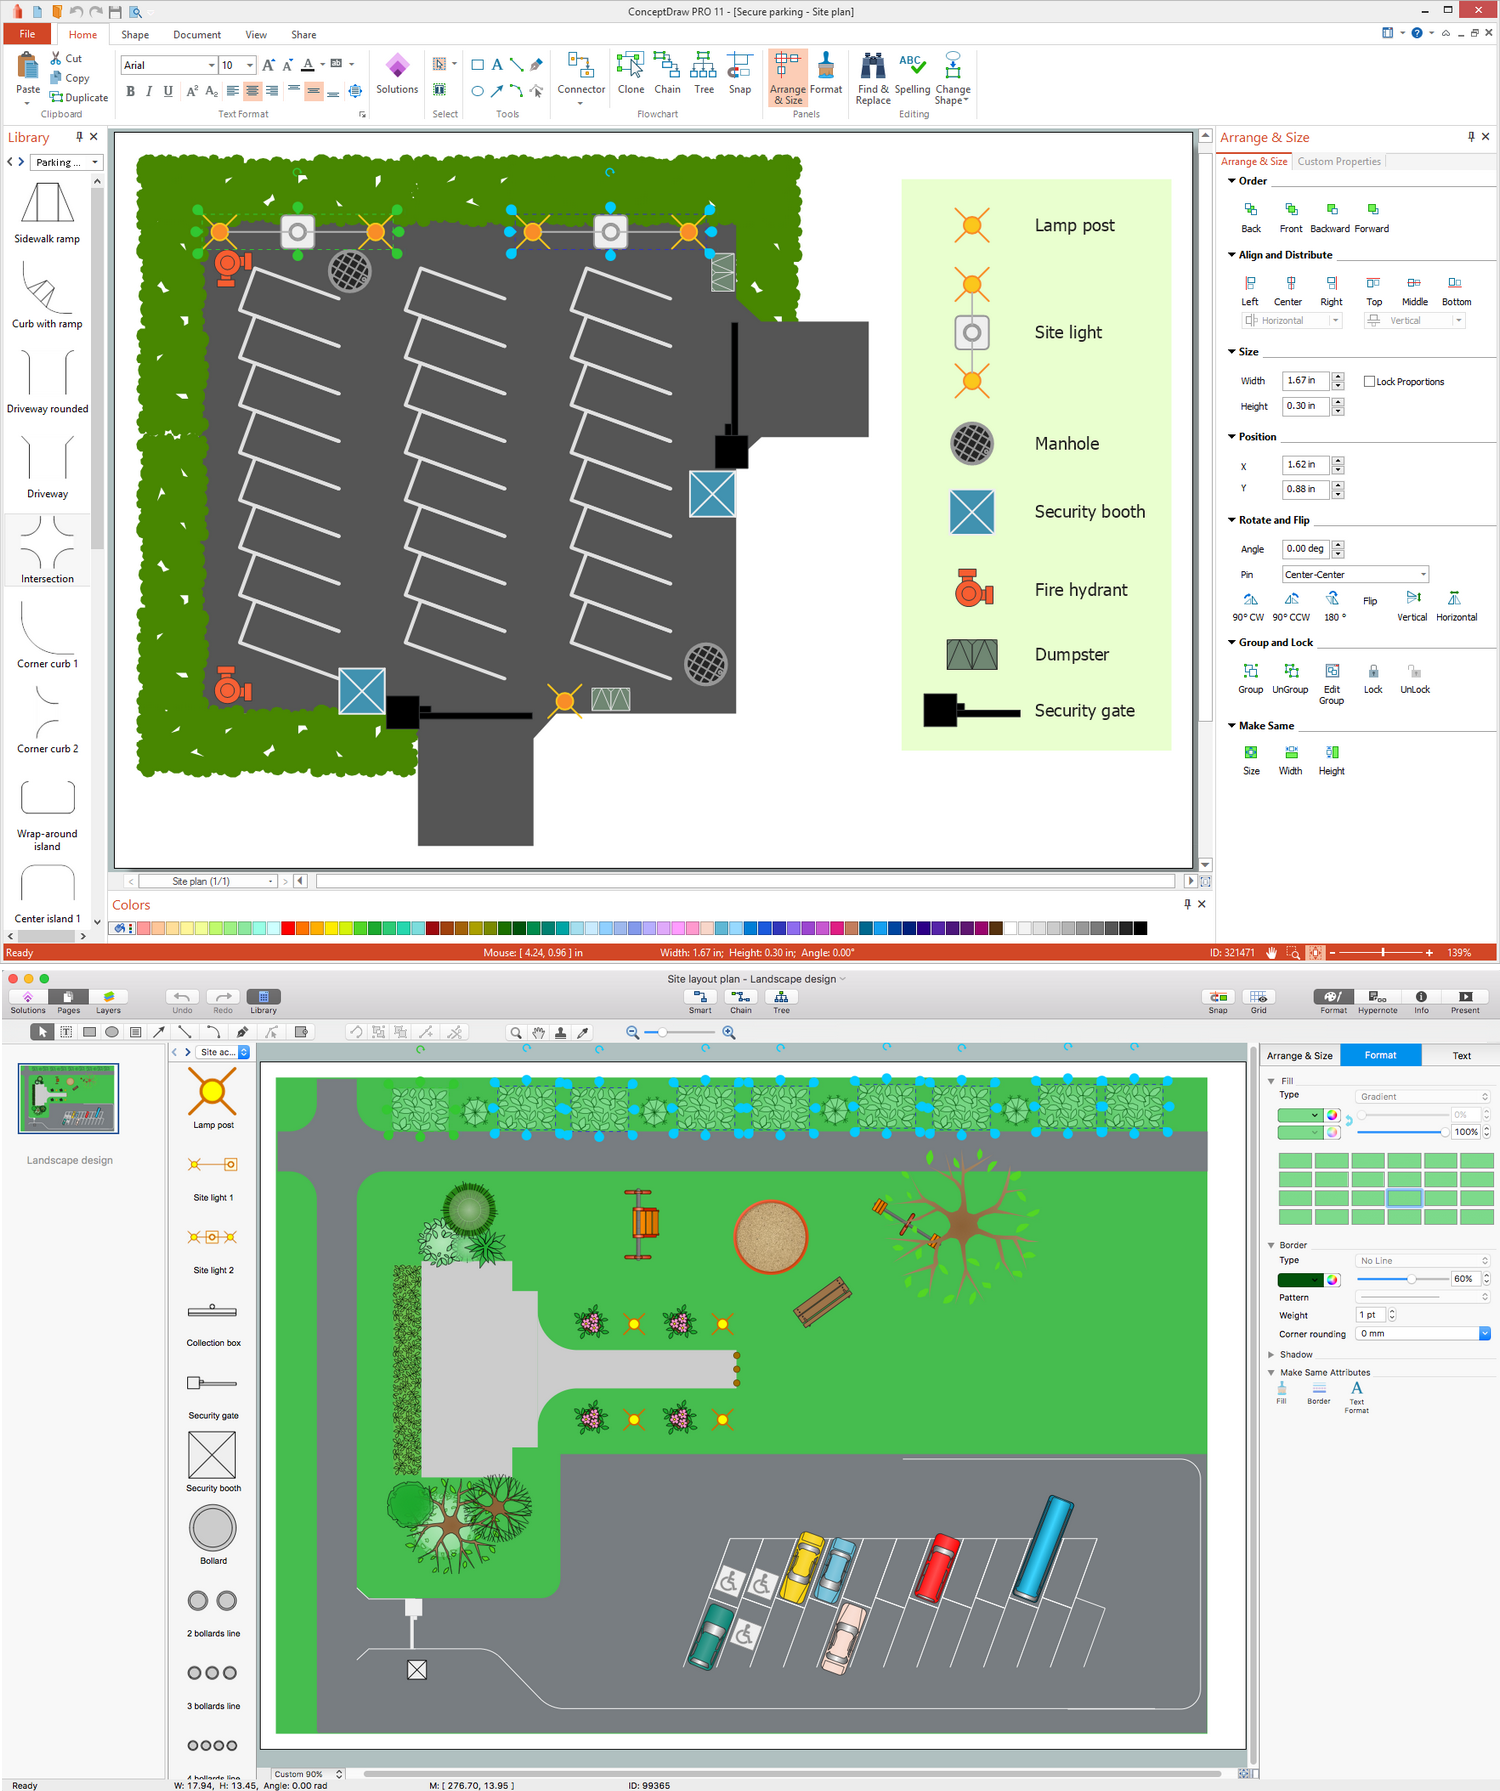
Site Plan Software
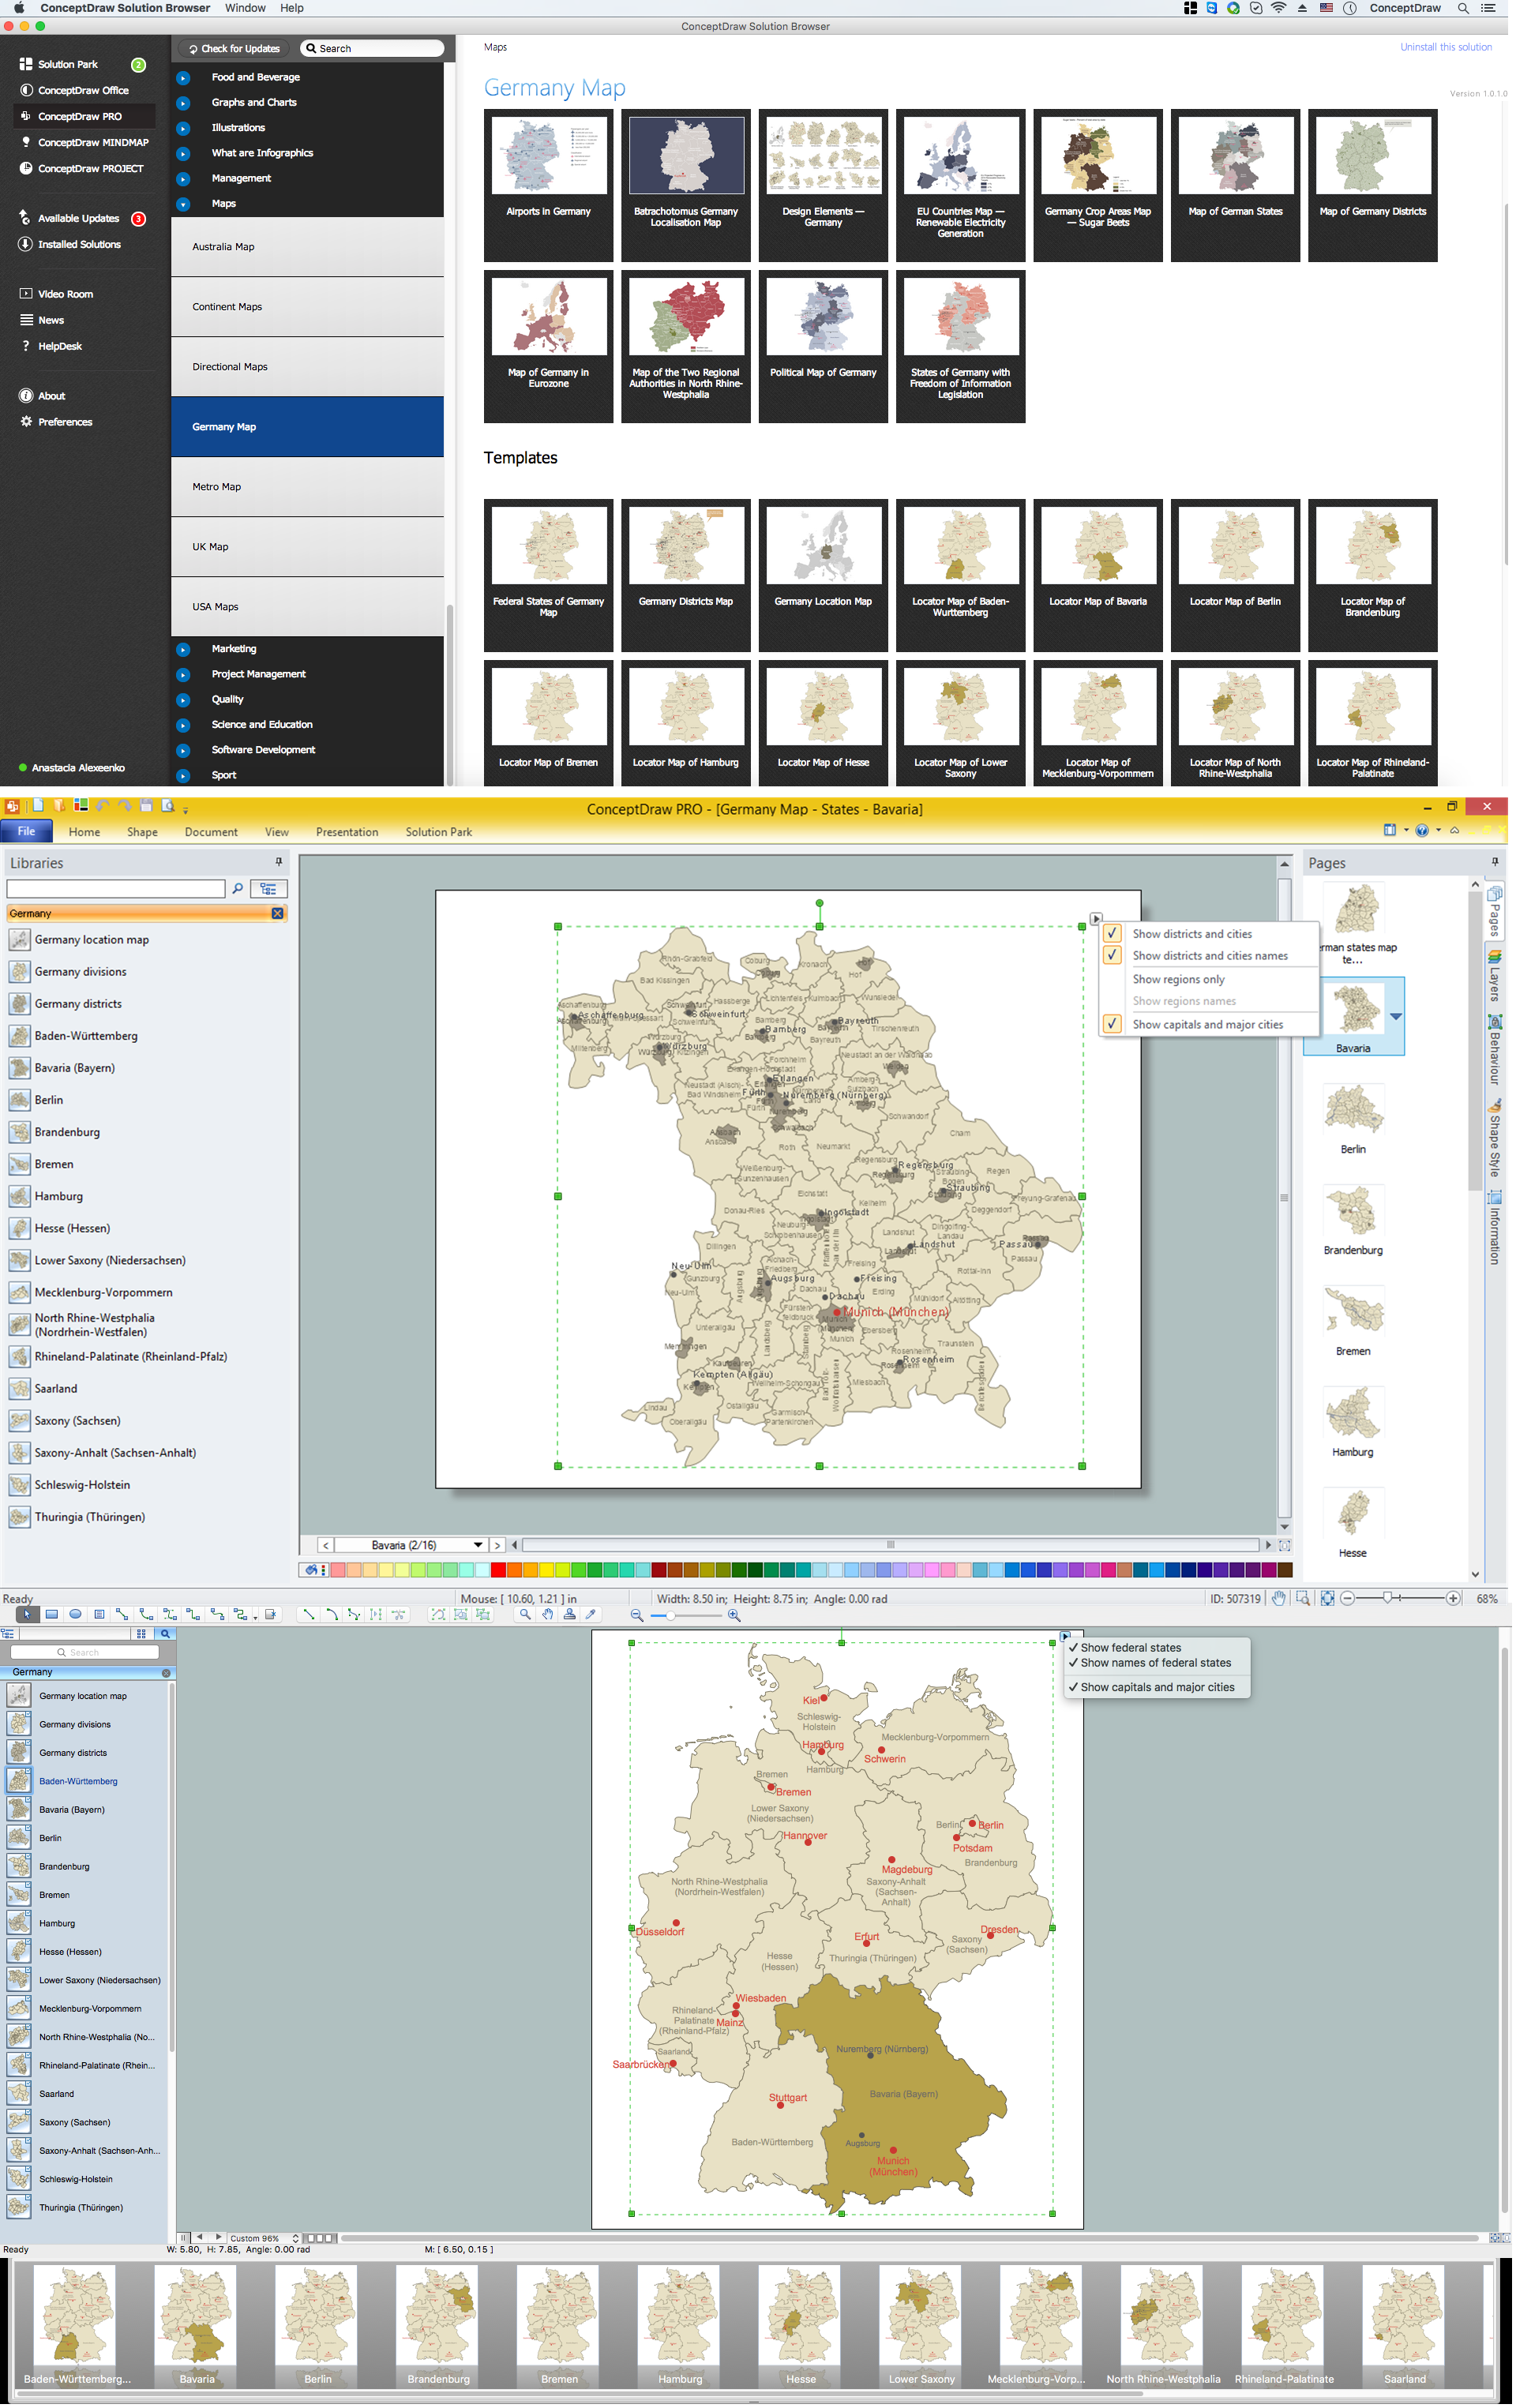
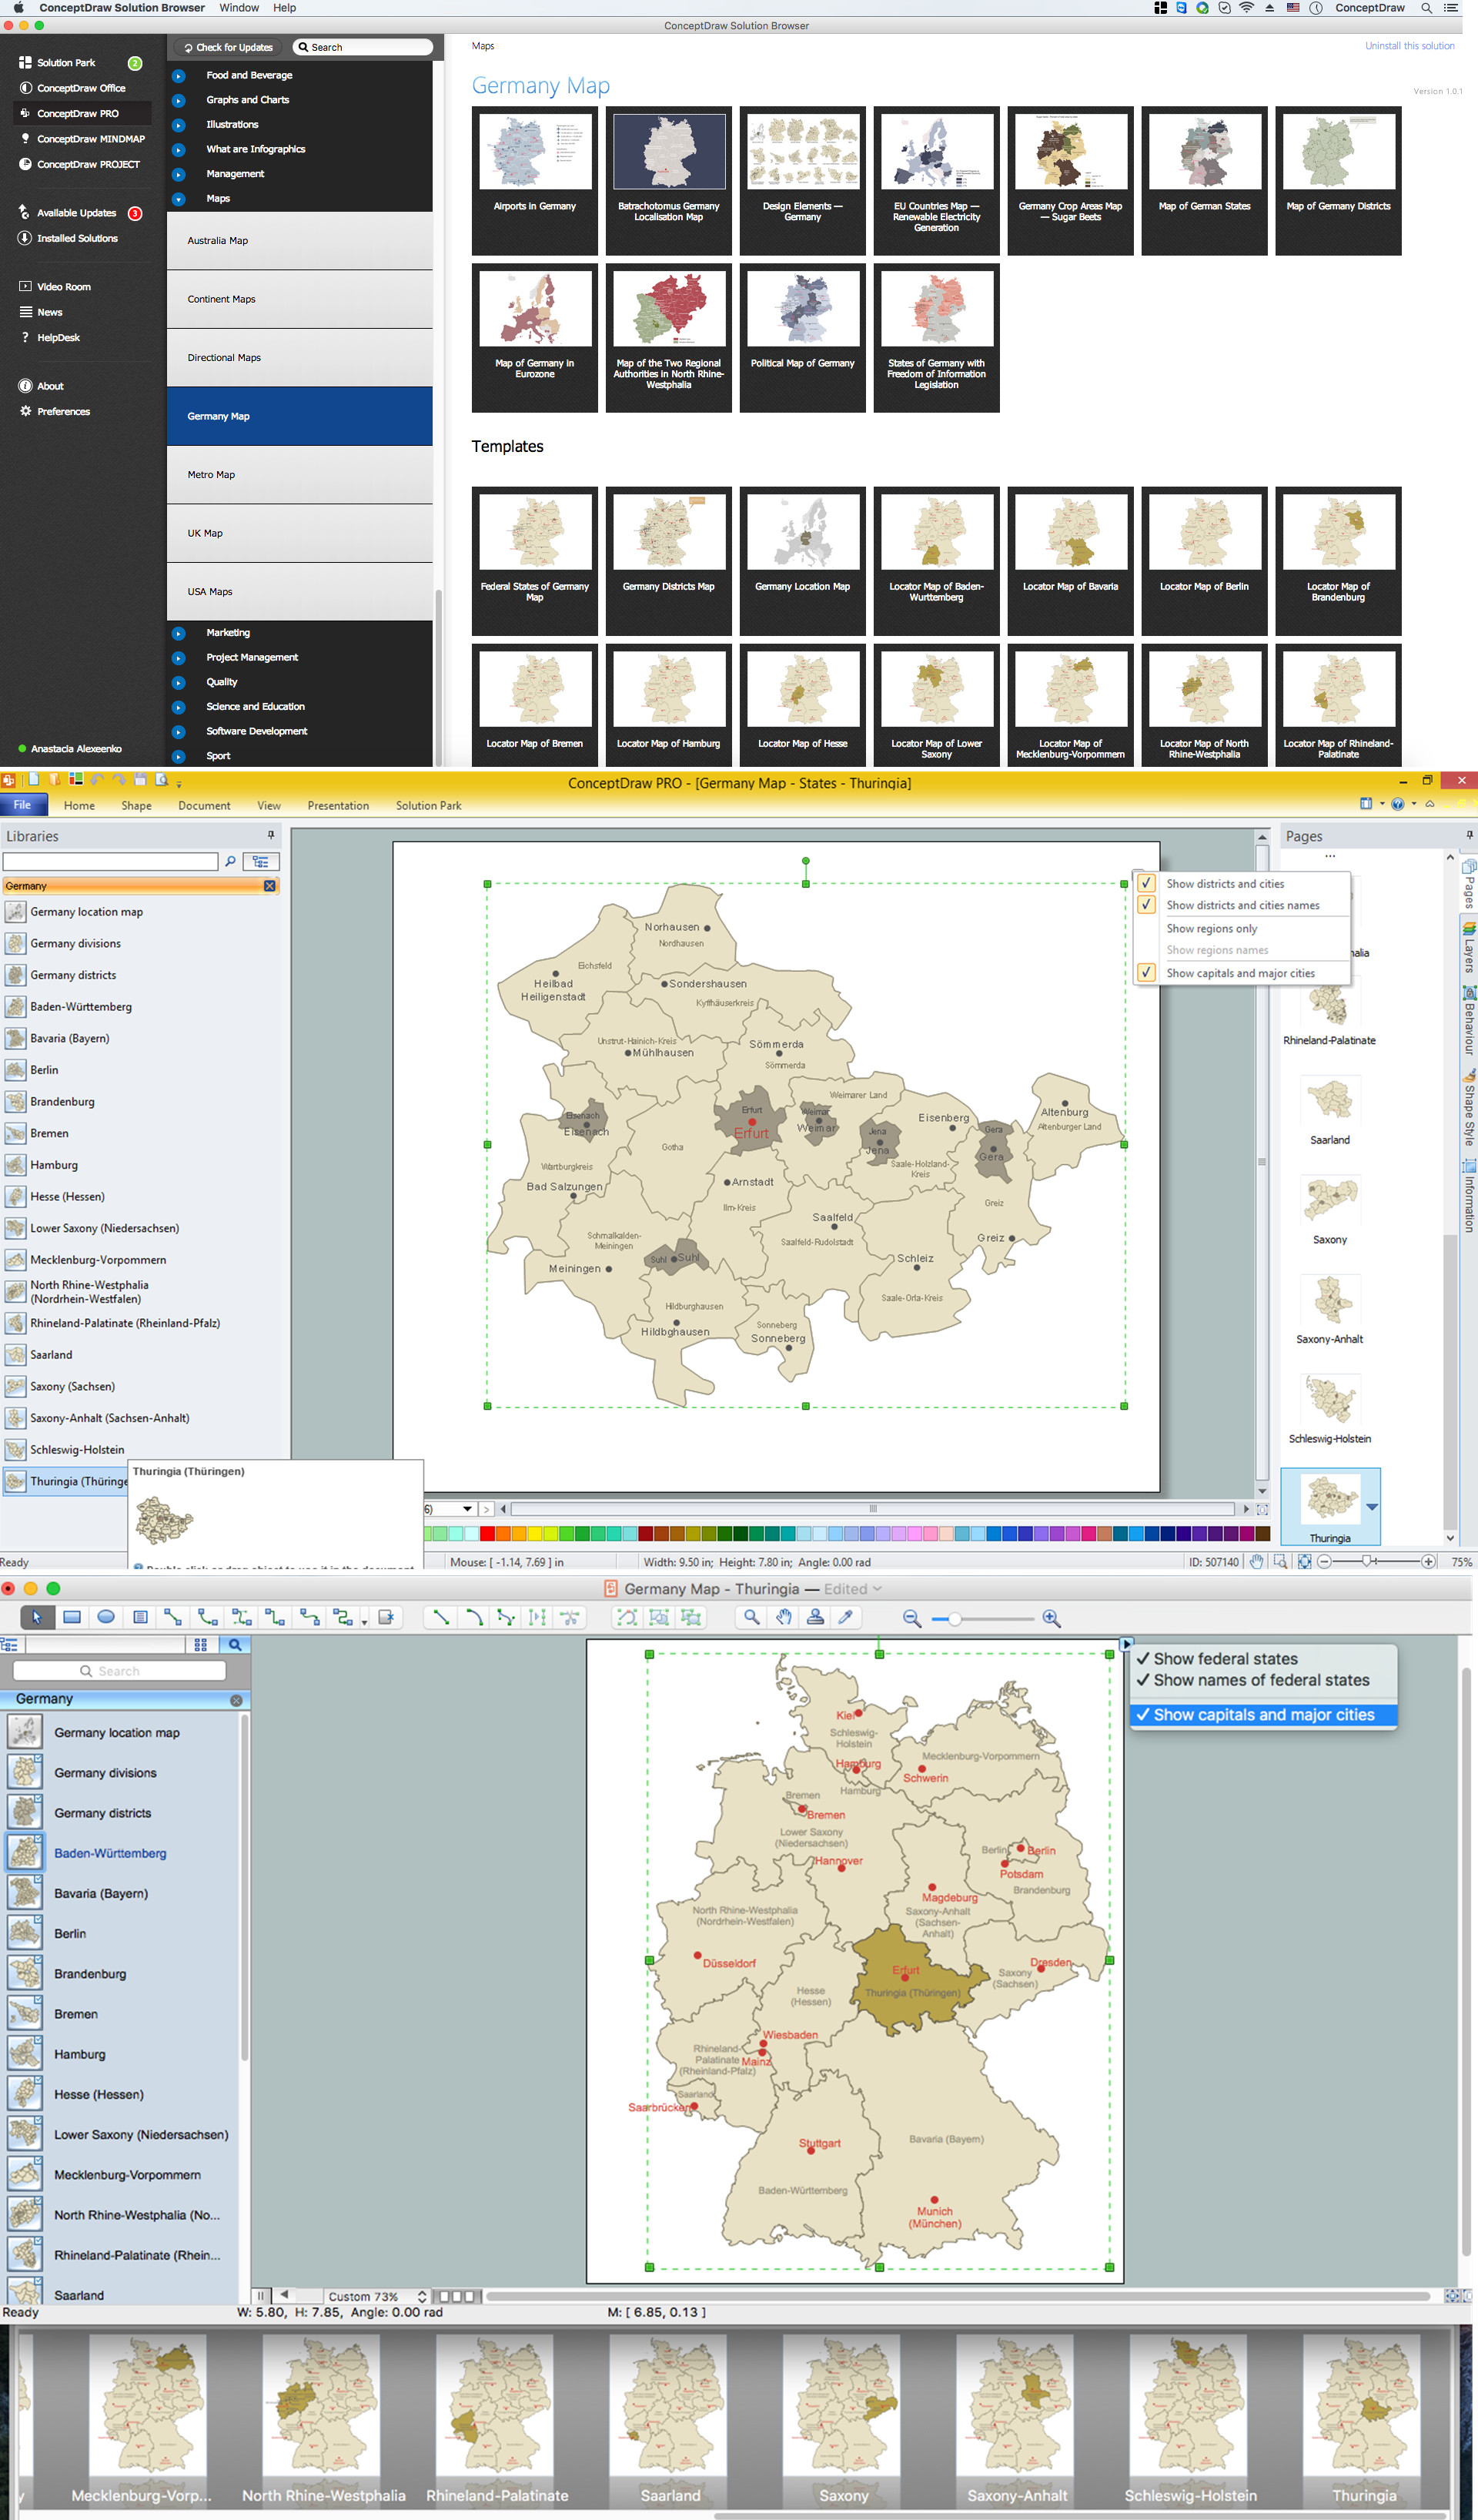
Map of Germany — Bavaria State
Geo Map — Asia — Vietnam

Local area network (LAN). Computer and Network Examples
 diagram")

Geo Map - Africa - Namibia

Map of Continents
Map of Germany — Thuringia State
Bubble diagrams in Landscape Design with ConceptDraw DIAGRAM

- Land Plot Layout Design Software
- Land sales process flowchart
- Office fire and emergency plan | Land Layout Drawing Software
- Network Visualization with ConceptDraw PRO | Example Of Land ...
- Network Layout | Free Land Layout Design Software
- Land Resources Flow Chat
- Design elements - Rail transport | Land Transport Art Diagram
- Design elements - Plumbing | Land Layout Design Software
- Flow Chart On Land Resources
- Computer and Networks Area | Software Engineer Package | Land ...