This data-driven infographics example was redesigned from the Wikimedia Commons file: Benjamin Ebel Quick You Tube Survey Results.jpg.
The infographic survey includes horizontal bar graph "More Youtube than TV?", column chart "When do you watch Youtube?", and bubble diagram "Most watched content?". [commons.wikimedia.org/ wiki/ File:Benjamin_ Ebel_ Quick_ You_ Tube_ Survey_ Results.jpg]
This file is licensed under the Creative Commons Attribution-Share Alike 3.0 Unported license. [creativecommons.org/ licenses/ by-sa/ 3.0/ deed.en]
The column chart and bar graph sample "Quick YouTube Survey" was created using the ConceptDraw PRO diagramming and vector graphics software extended with the Data-driven Infographics" solution from the area "What is infographics" of ConceptDraw Solution Park.
Data-driven infographics

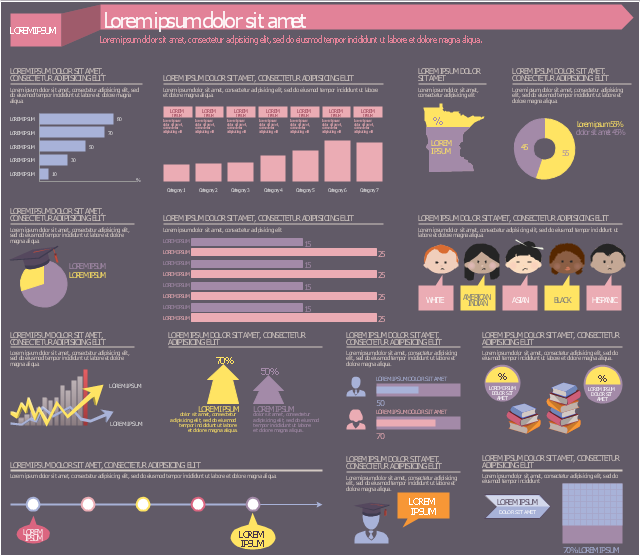
This education infographic template consists of design elements: callouts, horizontal bar chart, column chart (vertical bar graph), state map contour, donut chart indicator, pie chart indicator, horizontal bar chart indicators, arrow chart indicator, bullet indicators, square chart 10x10 indicator, pictograms.
Simply add text to design your own educational infogram.
The template "Education infogram 5" for the ConceptDraw PRO diagramming and vector drawing software is included in the Education Infographics solition from the area "Business Infographics" in ConceptDraw Solution Park.
Simply add text to design your own educational infogram.
The template "Education infogram 5" for the ConceptDraw PRO diagramming and vector drawing software is included in the Education Infographics solition from the area "Business Infographics" in ConceptDraw Solution Park.
Educational infogram template
Used Solutions
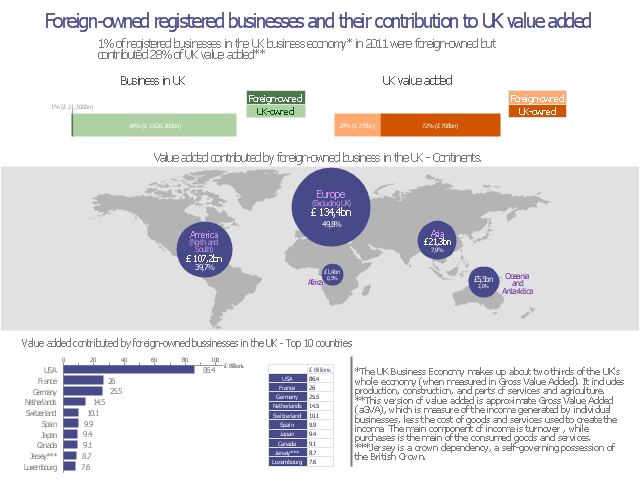
This data-driven infographics example was redesigned from the Wikimedia Commons file: Foreign-owned registered businesses and their contribution to UK value added.png.
"A snapshot of ONS’s Annual Business Survey (ABS) to look at the contribution that foreign-owned registered businesses (20.9 Kb Pdf) in the UK make to the UK Business Economy, and their country of ownership." [commons.wikimedia.org/ wiki/ File:Foreign-owned_ registered_ businesses_ and_ their_ contribution_ to_ UK_ value_ added.png]
The divided bar diagram and bar chart example "Value added contributed by foreign-owned" was created using the ConceptDraw PRO diagramming and vector graphics software extended with the Data-driven Infographics" solution from the area "What is infographics" of ConceptDraw Solution Park.
Data-driven infographics
Used Solutions
Scatter Graph Charting Software

 Bar Graphs
The Bar Graphs solution enhances ConceptDraw DIAGRAM functionality with templates, numerous professional-looking samples, and a library of vector stencils for drawing different types of Bar Graphs, such as Simple Bar Graph, Double Bar Graph, Divided Bar Graph, Horizontal Bar Graph, Vertical Bar Graph, and Column Bar Chart.
Chart Maker for Presentations

HelpDesk
How to Create a Bar Chart

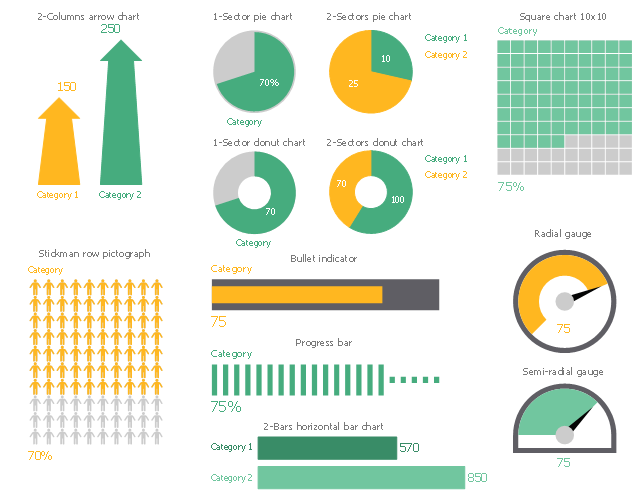
The vector stencils library "Financial indicators" contains 12 graphic indicators.
Graphic indicators visualize status information and business metrics as easy to understand pictures.
Use it to design your financial infographics.
Graphic indicators visualize status information and business metrics as easy to understand pictures.
Use it to design your financial infographics.
Infographic elements
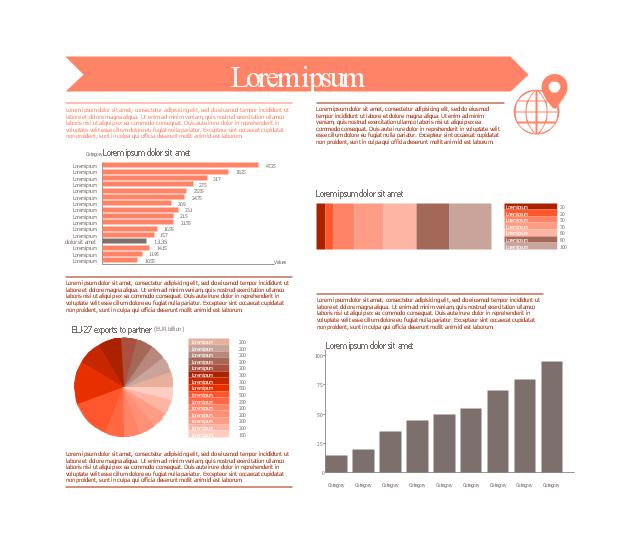
This marketing infographic template consists of design elements: title block, callout blocks, pictogram, horizontal bar graph, column chart, divided bar diagram, pie chart.
Use it to create your marketing infograms in the ConceptDraw PRO diagramming and vector drawing software.
The template "Marketing infogram 3" is included in the Marketing Infographics solution from the Business Infographics area of ConceptDraw Solution Park.
Use it to create your marketing infograms in the ConceptDraw PRO diagramming and vector drawing software.
The template "Marketing infogram 3" is included in the Marketing Infographics solution from the Business Infographics area of ConceptDraw Solution Park.
Marketing infogram template
 Basic Bar Graphs
This solution enhances ConceptDraw DIAGRAM (or later) with templates, samples and a library of vector stencils for drawing Bar Graphs.
- Horizontal Bar Chart Examples Infographics
- Bar Chart Software | Bar Graphs | Bar Chart Examples | Horizontal ...
- Education Bar Chart
- Bar Chart Infographic Design
- Infographic Horizontal Bar
- Horizontal Bar Graph Infographic
- Arrows Bar Chart
- Education Package | Education charts - Vector stencils library | How ...
- Gauge Chart
- Continent Maps | Informative and Well-Designed Infographics | Bar ...