"Smaller mobile devices such as PDAs and smartphones typically use the WIMP elements with different unifying metaphors, due to constraints in space and available input devices. Applications for which WIMP is not well suited may use newer interaction techniques, collectively named as post-WIMP user interfaces.
As of 2011, some touch-screen-based operating systems such as Apple's iOS (iPhone) and Android use the class of GUIs named post-WIMP. These support styles of interaction using more than one finger in contact with a display, which allows actions such as pinching and rotating, which are unsupported by one pointer and mouse." [Graphical user interface. Wikipedia]
"In computing post-WIMP comprises work on user interfaces, mostly graphical user interfaces, which attempt to go beyond the paradigm of windows, icons, menus and a pointing device, i.e. WIMP interfaces. ...
However WIMP interfaces are not optimal for working with complex tasks such as computer-aided design, working on large amounts of data simultaneously, or interactive games. WIMPs are usually pixel-hungry, so given limited screen real estate they can distract attention from the task at hand. Thus, custom interfaces can better encapsulate workspaces, actions, and objects for specific complex tasks. Applications for which WIMP is not well suited include those requiring continuous input signals, showing 3D models, or simply portraying an interaction for which there is no defined standard widget.
Interfaces based on these considerations, now called "post-WIMP", have made their way to the general public. Examples include the interface of the classic MP3 player iPod and a bank's automated teller machine screen." [Post-WIMP. Wikipedia]
The example "iPhone OS (iOS) graphic user interface (GUI) - Activity indicator view" was created using the ConceptDraw PRO diagramming and vector drawing software extended with the Graphic User Interface solution from the Software Development area of ConceptDraw Solution Park.
iPhone GUI
-graphic-user-interface-(gui)---activity-indicator-view.png--diagram-flowchart-example.png)
Performance Indicators

HelpDesk
How to Create a Meter Dashboard

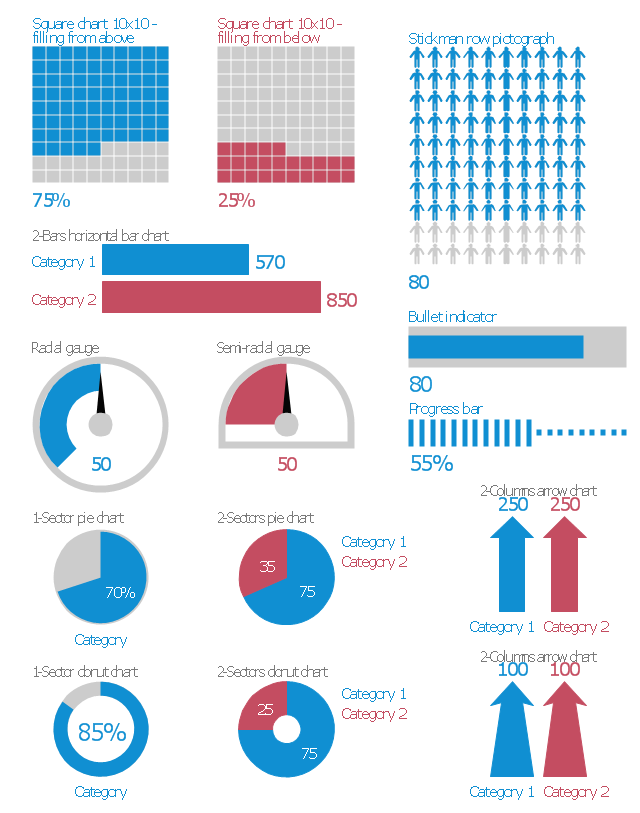
The vector stencils library "Marketing indicators" contains 12 graphic indicators: horizontal bar chart, pie chart, arrow chart, donut chart, square chart, stickman row pictograph, progress bar, bullet indicator, radial gauge, semi-radial gauge.
Use these visual indicators to design your marketing infograms.
The shapes example "Design elements - Marketing indicators" was created using the ConceptDraw PRO diagramming and vector drawing software extended with the Marketing Infographics solition from the area "Business Infographics" in ConceptDraw Solution Park.
Graphic indicators

The vector stencils library "Management indicators" contains 14 graphic indicators: horizontal bar chart, pie chart, arrow chart, donut chart, square chart, stickman row pictograph, progress bar, bullet indicator, radial gauge, semi-radial gauge.
Use these visual indicators to design your management infograms.
The shapes example "Design elements - Management indicators" was created using the ConceptDraw PRO diagramming and vector drawing software extended with the Management Infographics solition from the area "Business Infographics" in ConceptDraw Solution Park.
Graphic indicators
The vector stencils library "Composition indicators" contains 6 dashboard graphic indicators: 2 horizontal divided bars, 2 vertical divided bars, and 2 mini pie charts.
Composition Indicators are Live Objects which show the percentage of two parts of one total.
Composition Indicators useful for:
• comparison of one part with the total
• comparison of two parts of one total.
Use this library for drawing visual dashboards in the ConceptDraw PRO diagramming and vector drawing software extended with the Composition Dashboard solution from the area "What is a Dashboard" of ConceptDraw Solution Park.
www.conceptdraw.com/ solution-park/ composition-dashboard
Horizontal Divided Bar Indicator 1

Mini Pie Chart Indicator 1

Vertical Divided Bar Indicator 1

Horizontal Divided Bar Indicator 2

Vertical Divided Bar Indicator 2

Mini Pie Chart Indicator 2

The vector stencils library "Mac OS X Lion user interface" contains 52 UI design elements.
Use it for designing Mac OS X Lion graphic user interface (GUI) of software for Apple computers in the ConceptDraw PRO diagramming and vector drawing software extended with the Graphic User Interface solution from the Software Development area of ConceptDraw Solution Park.
Use it for designing Mac OS X Lion graphic user interface (GUI) of software for Apple computers in the ConceptDraw PRO diagramming and vector drawing software extended with the Graphic User Interface solution from the Software Development area of ConceptDraw Solution Park.
Title Bar
Title Bar Inactive
Window

Window Inactive

Window Title Bar

Window Title Bar (Inactive)
-mac-os-x-lion-user-interface---vector-stencils-library.png--diagram-flowchart-example.png)
Full Screen Button

Exit Full Screen Button

Window without Bar

Window (Narrow Toolbar)
-mac-os-x-lion-user-interface---vector-stencils-library.png--diagram-flowchart-example.png)
Window Inactive (Narrow Toolbar)
-mac-os-x-lion-user-interface---vector-stencils-library.png--diagram-flowchart-example.png)
Panel (Hud Window)
-mac-os-x-lion-user-interface---vector-stencils-library.png--diagram-flowchart-example.png)
Panel (Hud Window) (Inactive)
-(inactive)-mac-os-x-lion-user-interface---vector-stencils-library.png--diagram-flowchart-example.png)
Box 1

Box 2

Field
List View 1

List View 2

Scroll Bar Vertical

Scroll Bar Horizontal

Main Menu
Menu Bar

Menu

Vertical Line

Horizontal Line

Apple Menu

Arrow mark
Combo Box

Pop Up Menu

Text Field

Count Button

Search Field

Check Box

Check Box

Group of Check Boxes

Radio Button

Radio Button

Group of Radio Buttons

Linear Slider (round thumb)
-mac-os-x-lion-user-interface---vector-stencils-library.png--diagram-flowchart-example.png)
Linear Slider (directional thumb)
-mac-os-x-lion-user-interface---vector-stencils-library.png--diagram-flowchart-example.png)
Circular Slider

Color Well

Relevance Indicator

Rating Indicator

Indeterminate Progress Bar

Determinate Progress Bar

Continuous Capacity Indicator

Discrete Capacity Indicator

Discrete Capacity Indicator (yellow)
-mac-os-x-lion-user-interface---vector-stencils-library.png--diagram-flowchart-example.png)
Discrete Capacity Indicator (red)
-mac-os-x-lion-user-interface---vector-stencils-library.png--diagram-flowchart-example.png)
Asynchronous Progress Indicator

Circular Progress Indicator

The vector stencils library "Sales KPIs and Metrics" contains 15 chart templates and graphic indicators of sales key performance indicators (KPIs) and metrics for drawing sales dashboards: line charts "Cost per order" and "Clicks from Sales Follow-Up Emails", column charts "Social Media Usage" and "Usage Rate of Marketing Collateral", horizontal bar charts "Rate of Follow Up Contact", "Cost per customer" and "Lead Response Time", pie charts "Product mix", "Product Performance" and "Rate of Contact", gauge (speedometer) indicators "Sales Growth" and "Actual vs Plan", bullet indicator "Sales Target", diamond alarm indicators "Average Purchase Value", "Quote to Close Ratio", "Opportunity-to-Win Ratio" and "Sales Ratio".
The dashboard charts and indicators example "Design elements - Sales KPIs and metrics" for the ConceptDraw PRO diagramming and vector drawing software is included in the Sales Dashboard solution from the Marketing area of ConceptDraw Solution Park.
www.conceptdraw.com/ solution-park/ marketing-sales-dashboard
Sales dashboard charts and graphic indicators

The vector stencils library "Education indicators" contains 12 graphic indicators.
Use these visual indicators to design your educational infogram.
The vector stencils library "Education indicators" is included in the Education Infographics solution from the Business Infographics area of ConceptDraw Solution Park.
Use these visual indicators to design your educational infogram.
The vector stencils library "Education indicators" is included in the Education Infographics solution from the Business Infographics area of ConceptDraw Solution Park.
1-Sector donut chart

2-Sectors donut chart

1-Sector pie chart

2-Sectors pie chart

2-Bars horizontal bar chart

2-Columns arrow chart
Bullet indicator

Progress bar

Radial gauge

Semi-radial gauge

Square chart 10x10 - filling from above

Stickman row pictograph

 Graphic User Interface
Graphic User Interface solution extends ConceptDraw PRO software with templates, samples and libraries of vector stencils for design of the GUI prototypes and diagrams for Windows, Mac OS and iOS software.
The vector stencils library "Mac OS X user interface" contains 54 UI design elements.
Use it for designing Mac OS X graphic user interface (GUI) of software for Apple computers in the ConceptDraw PRO diagramming and vector drawing software extended with the Graphic User Interface solution from the Software Development area of ConceptDraw Solution Park.
Use it for designing Mac OS X graphic user interface (GUI) of software for Apple computers in the ConceptDraw PRO diagramming and vector drawing software extended with the Graphic User Interface solution from the Software Development area of ConceptDraw Solution Park.
Tool Bar

Textured Window

Window

Window Header

Window

Panel

Panel (Hud Window)
-mac-os-x-user-interface---vector-stencils-library.png--diagram-flowchart-example.png)
Tool Bar (Inactive)
-mac-os-x-user-interface---vector-stencils-library.png--diagram-flowchart-example.png)
Textured Window (Inactive)
-mac-os-x-user-interface---vector-stencils-library.png--diagram-flowchart-example.png)
Window (Inactive)
-mac-os-x-user-interface---vector-stencils-library.png--diagram-flowchart-example.png)
Window Header (Inactive)
-mac-os-x-user-interface---vector-stencils-library.png--diagram-flowchart-example.png)
Panel (Inactive)
-mac-os-x-user-interface---vector-stencils-library.png--diagram-flowchart-example.png)
Panel (Hud Window) (Inactive)
-(inactive)-mac-os-x-user-interface---vector-stencils-library.png--diagram-flowchart-example.png)
Box 1

Box 2

Tree

Tree

Vertical Scroll 1

Vertical Scroll 2

Horizontal Scroll 1

Horizontal Scroll 2

Main Menu
Main Menu

Drop-down Menu

Vertical Separator

Horizontal Separator

Apple

Combo-box

Popup Button

Popup Button (Pull Down)
-mac-os-x-user-interface---vector-stencils-library.png--diagram-flowchart-example.png)
Text Field

Searcher

Check Box

Check Box

Group of Check Boxes

Radio Button

Radio Button

Group of Radio Buttons

Linear Slider
Linear Slider with tick marks
Circular Slider

Color Well

Relevancy Level Indicator

Rating Level Indicator

Indeterminate Progress Bar

Non Indeterminate Progress Bar

Continuous Level Indicator

Discrete Level Indicator

Discrete Level Indicator

Discrete Level Indicator

Circular Progress Indicator (non indeterminate)
-mac-os-x-user-interface---vector-stencils-library.png--diagram-flowchart-example.png)
Circular Progress Indicator (indeterminate)
-mac-os-x-user-interface---vector-stencils-library.png--diagram-flowchart-example.png)
Field

Arrow
Basic Flowchart Symbols and Meaning


 Dashboards Area
Solutions from the area Dashboards of ConceptDraw Solution Park collects templates, samples and vector stencils libraries with of data driven charts and indicators for drawing the basic types of Visual Dashboards.
Constant improvement of key performance indicators

HelpDesk
How to Create a Time Series Dashboard

- iPhone OS (iOS) graphic user interface (GUI) - Activity indicator view ...
- Performance Indicators | How to Connect Tabular Data (CSV) to a ...
- iPhone OS (iOS) graphic user interface (GUI) - Activity indicator view
- How to Connect Tabular Data (CSV) to a Graphic Indicator on Your ...
- Quality Status Indicator Graphics
- Graphic User Interface
- Graphical User Interface Graphic
- How to Connect Tabular Data (CSV) to a Graphic Indicator on Your ...
- Management indicators - Vector stencils library | Education ...
- Performance Indicators | Comparison indicators - Vector stencils ...
- Design elements - Comparison charts and indicators | Performance ...
- Design elements - Sales KPIs and metrics | Performance Indicators ...
- Performance Indicators | Constant improvement of key performance ...
- Performance Indicators | Design elements - Sales KPIs and metrics ...
- Management indicators - Vector stencils library | Education ...
- Dashboard Graphic
- Dashboard Indicators
- Performance Indicators | | | Dashboard Indicator
- Performance Indicators | Design elements - Sales dashboard | Sales ...
- Graphic indicators