Bar Diagrams for Problem Solving. Create business management bar charts with Bar Graphs Solution

Bar Diagrams for Problem Solving. Create event management bar charts with Bar Graphs Solution

Bar Chart Template

This picture bar graph sample shows the computer and Internet use at home from 1984 to 2014. It was designed using data from website of the United States Census Bureau (USCB).
[census.gov/ content/ dam/ Census/ library/ visualizations/ 2016/ comm/ digital_ nation.png]
"Home automation is the residential extension of building automation and involves the control and automation of lighting, heating, ventilation, air conditioning (HVAC), appliances, and security. Modern systems generally consist of switches and sensors connected to a central hub sometimes called a "gateway" from which the system is controlled with a user interface that is interacted either with a wall-mounted terminal, mobile phone software, tablet computer or a web interface." [Home automation. Wikipedia]
The pictorial chart example "Computer and Internet use at home over time" was created using the ConceptDraw PRO diagramming and vector drawing software extended with the Picture Graphs solution from the Graphs and Charts area of ConceptDraw Solution Park.
Image chart

Waterfall Bar Chart

Bar Chart Examples

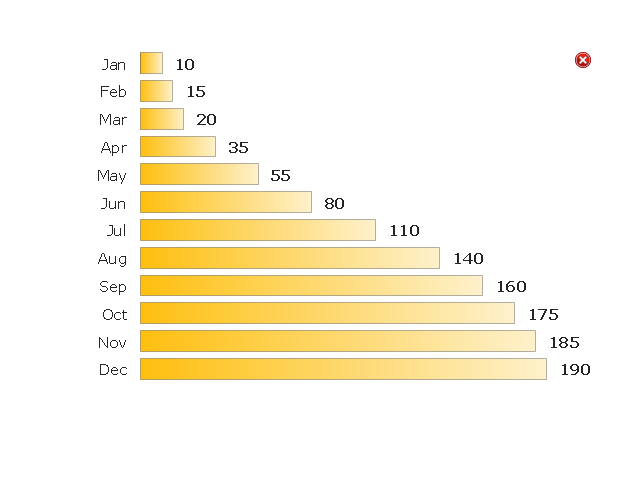
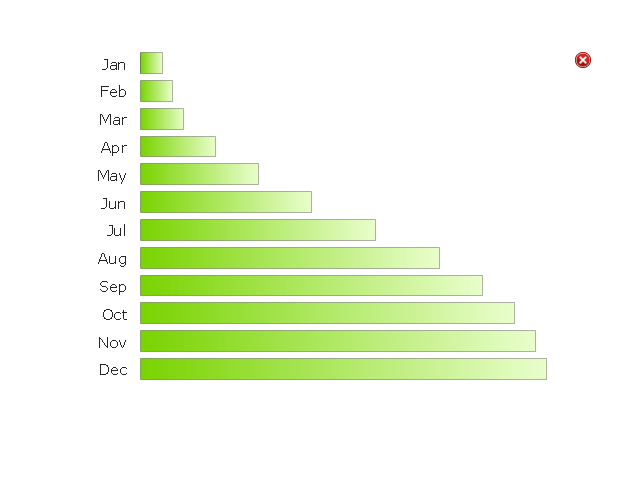
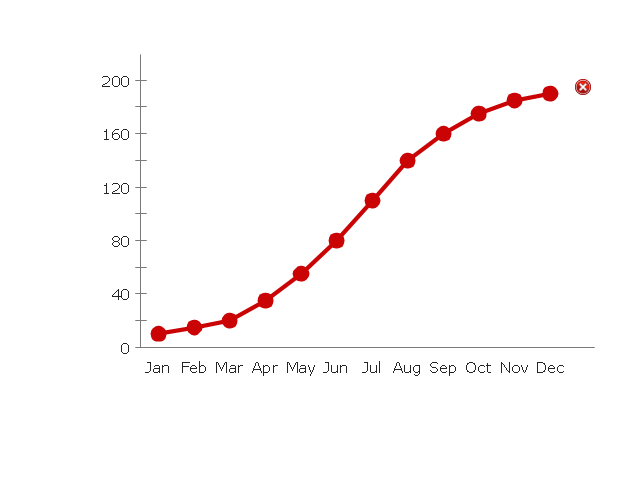
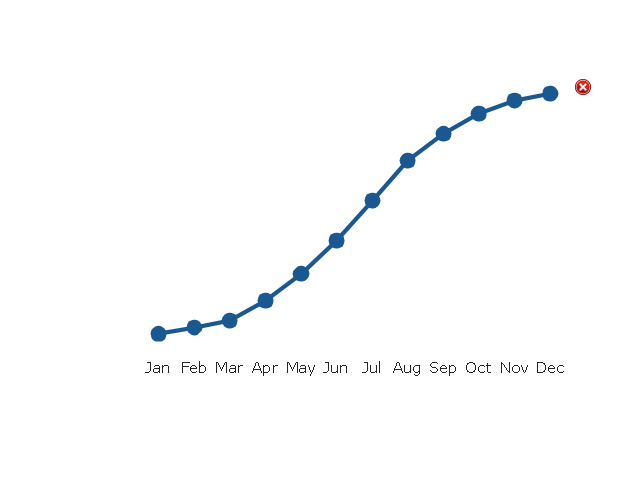
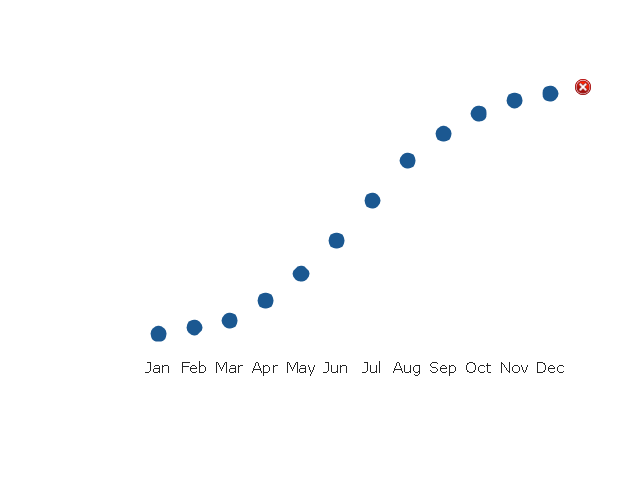
The vector stencils library "Time series charts" contains 10 templates of time series charts: 3 column charts, 3 bar charts, 2 line graphs and 2 dot plots. All these time series charts are Live Objects displaying the data from external data source files.
Use this library to create your visual dashboards in the ConceptDraw PRO diagramming and vector drawing software extended with the Time Series Dashboard solution from the area "What is a Dashboard" of ConceptDraw Solution Park.
Use this library to create your visual dashboards in the ConceptDraw PRO diagramming and vector drawing software extended with the Time Series Dashboard solution from the area "What is a Dashboard" of ConceptDraw Solution Park.
Column Chart 1
Column Chart 2
Column Chart 3
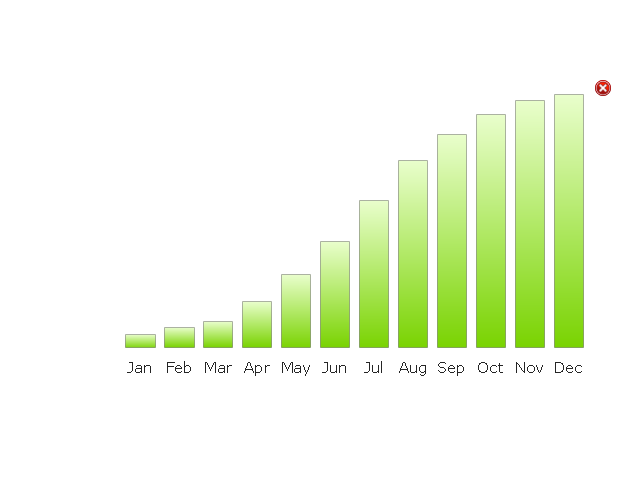
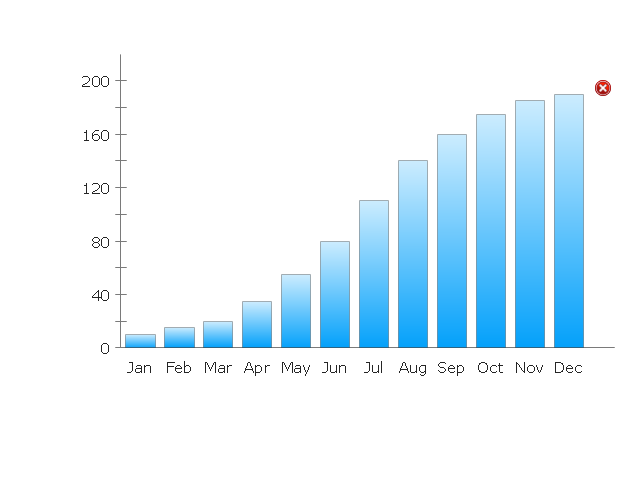
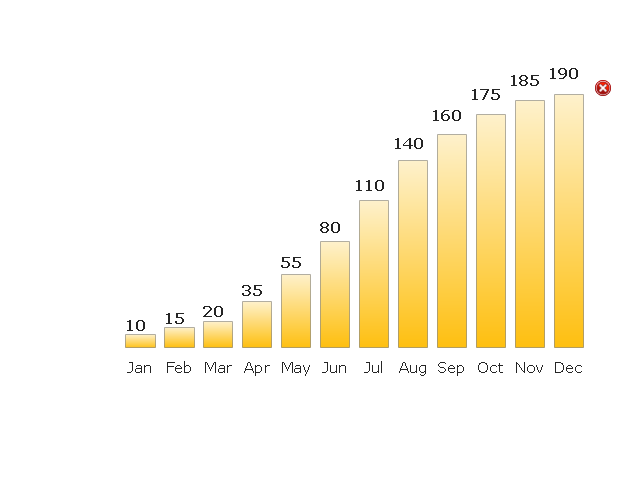
Bar Chart 1
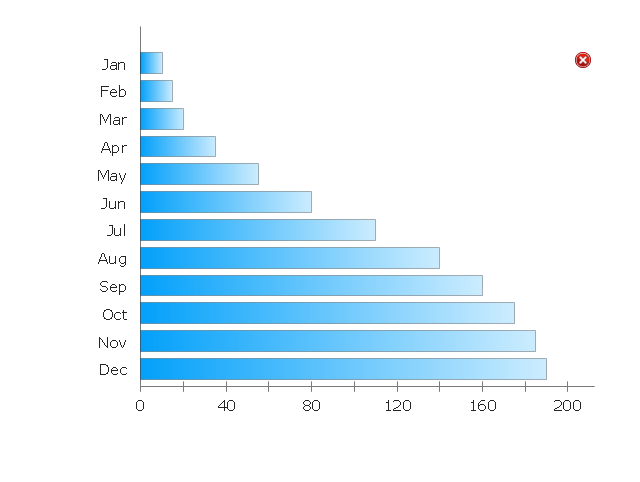
Bar Chart 2
Bar Chart 3
Line Chart 1
Line Chart 2
Dot Plot 1
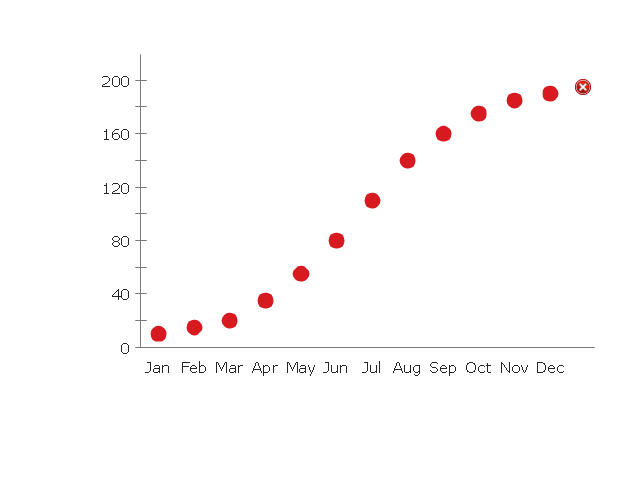
Dot Plot 2
Bar Graph

Chart Examples

Bar Charts

- Schedule pie chart - Daily action plan | Chart Examples | Bar Graphs ...
- Bar Graphs | Sales Growth. Bar Graphs Example | Picture Graphs ...
- Bar Chart Line Horizontal Time Series
- Time Sequenced Bar Chart
- Bar Chart Examples | Time series charts - Vector stencils library | Bar ...
- Chart Maker for Presentations | Bar chart - Template | Line Chart ...
- Schedule pie chart - Daily action plan | Pareto Chart | Bar Diagrams ...
- Schedule pie chart - Daily action plan | PM Personal Time ...
- Bar chart - Template | Bar Chart Examples | Bar Chart Software ...
- Bar Graphs | Basic Bar Graphs | Bar Diagrams for Problem Solving ...