HelpDesk
How to Manage a Multiple Project Participants Responsibilities with To-Do Mind Maps
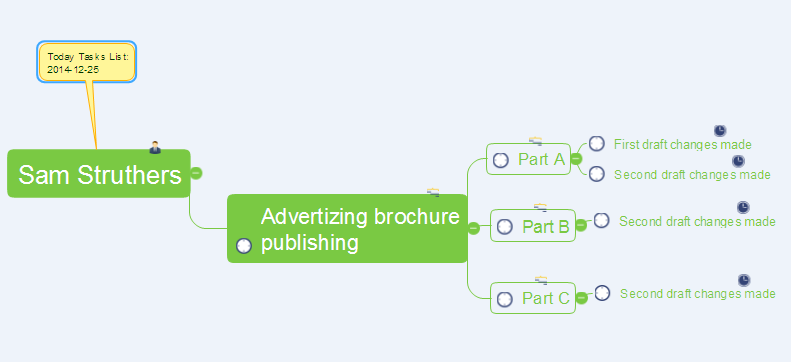
All project participants are kept informed of their responsibilities in projects and can detail their tasks in a creative mind map format.
 Seven Management and Planning Tools
Seven Management and Planning Tools solution extends ConceptDraw PRO and ConceptDraw MINDMAP with features, templates, samples and libraries of vector stencils for drawing management mind maps and diagrams.
HelpDesk
How to Use a Cross - Functional Flowcharts Solution
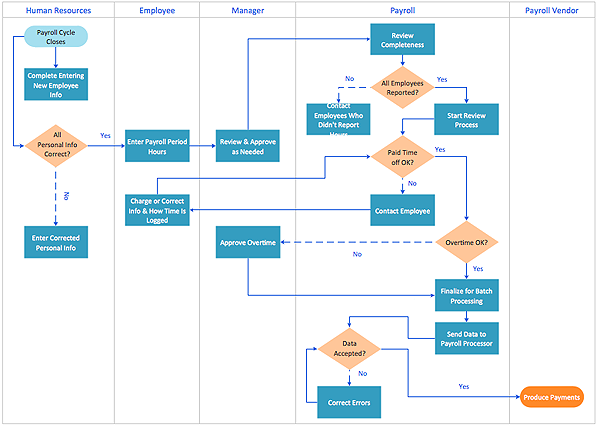
Cross-functional process is a process that involves multiple divisions, each of which makes its part of the entire company workflow. For example: product development, lead management , client orders processing – and other critical processes. Using a Cross-Functional flowchart is a clear way of showing each team member’s responsibilities and how processes get shared or transferred between different teams and departments.The Cross-Functional flowchart is a clear way to visualize the document flow in your organization. The ability to create Cross-functional diagrams is provided by the Cross-Functional Flowcharts solution.
HelpDesk
How to Create a Sales Flowchart Using ConceptDraw PRO
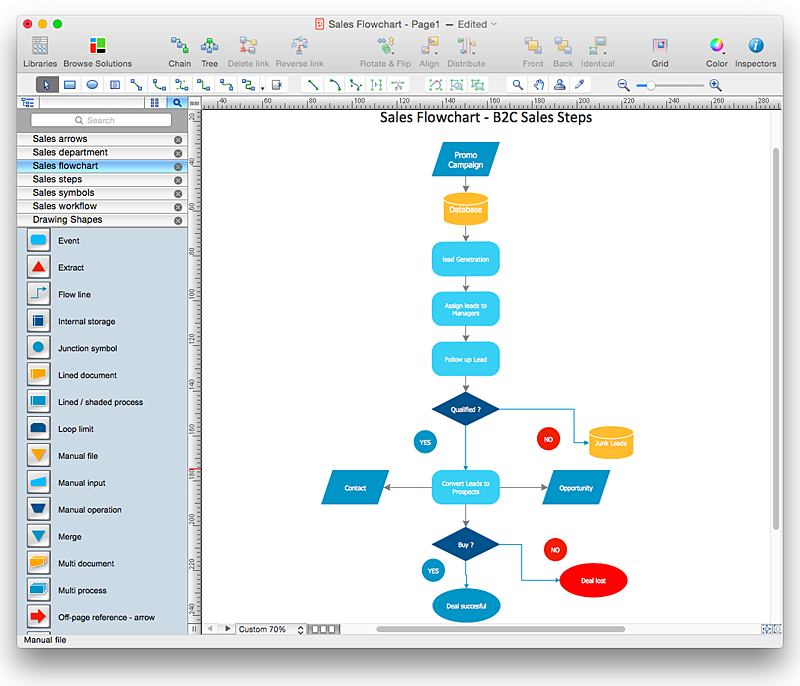
A Sales flowchart is a specialized type of flowchart. With the help of a sales flowchart you can visually describe tasks, documents, people responsible for execution at each stage of the sales process. For most commercial organizations, the sales process is inherent to its existence and ability to create profit. Although each company will achieve this aim in its own way, the core selling process remains similar throughout — a potential buyer or prospective customer exchanges money with an organization in return for goods or services. Despite this rather simplistic definition, there exists huge scope as to which approach is taken. Indeed, it is not uncommon for the sales division to be the largest within a corporate structure, employing a team of salespeople, analysts, and the sales managers, who are in charge of sales division operations.The practical applications of sales process flowcharts are numerous and wide ranging. At sales level, you might map the process of customer interactHow to Draw Business Process Diagrams with RapidDraw Interface
Business Process Modeling Notation (BPMN) is a set of standard symbols that allow you to create a graphical view of a business process. The symbols were developed to help users develop standard, unified structure of processes, and any messages shared between these processes.HelpDesk
How to Create a Cross - Functional Flowchart Using ConceptDraw PRO
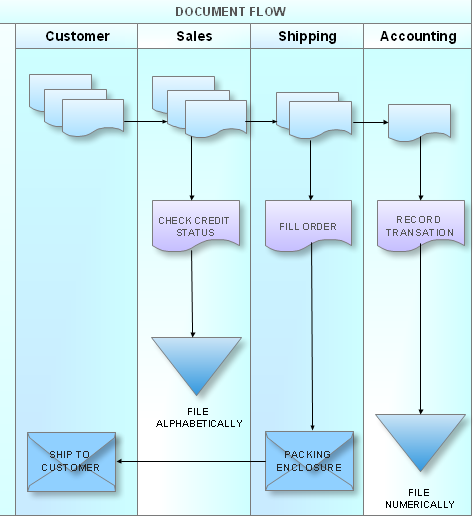
Cross-functional flowcharts are used to visualize cross-functional processes. Cross-functional process is a process that involves multiple divisions, each of which makes its part of the entire company workflow. For example: product development, lead management , client orders processing – and other critical processes. All of them are important both for business and customers, but the workflow and responsibilities distribution within these processes are divided between multiple departments and services. Cross-functional processes cannot be depicted with simple workflow diagrams, because of the specific interactions between company departments. ConceptDraw PRO has released the specialized solution to create cross-functional diagrams. Cross Functional Flowcharts solution includes a special set of templates and libraries to depict the cross-functional processes.
HelpDesk
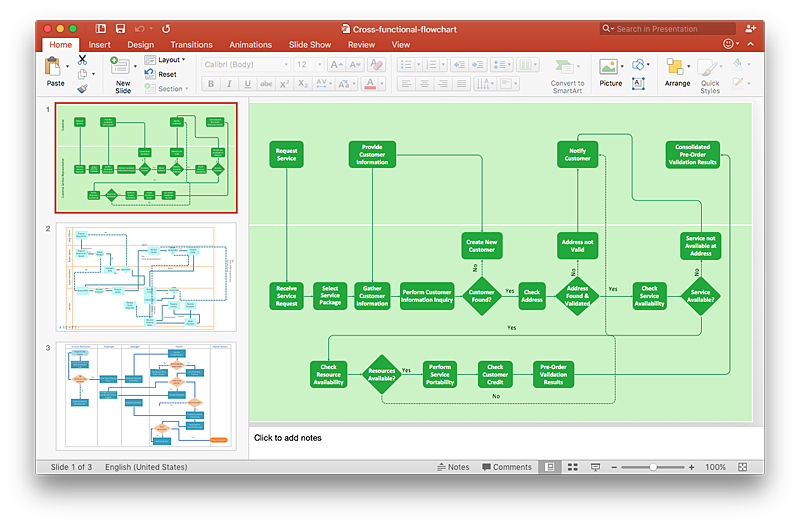
How to Add a Cross-Functional Flowchart to a PowerPoint Presentation Using ConceptDraw PRO
Using a Cross-Functional flowchart is a clear way of showing how business processes get shared or transferred between different teams and departments. ConceptDraw PRO allows you to make an MS PowerPoint Presentation from your flowcharts in a few simple steps.HelpDesk
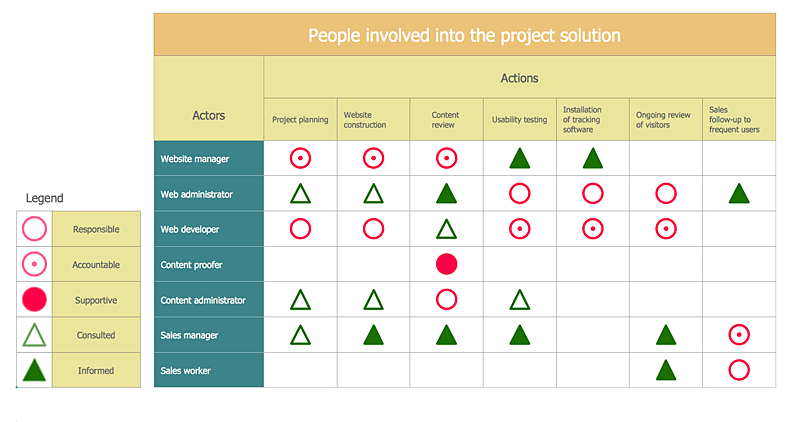
How To Create an Involvement Matrix
The Involvement Matrix can identify the distribution of responsibilities and identify roles in a group or team. This matrix can be used company wide. The Involvement Matrix identifies participants who are involved in corrective actions. The Involvement Matrix is constructed for all highly prioritized corrective actions. It uses symbols to assign who participates, performs, consults, should be informed, checks the work, and accepts the results. Using visual diagrams keeps ideas clear and is very effective when discussing the problem and a description of the solution. They are great at helping to quickly see what stage of the problem-solving effort is currently underway.It defines the participants and their roles. The matrix displays all of the parties involved, defines their level of involvement, and the nature of their participation. The ability to create an Involvement Matrix is supported by the ConceptDraw Seven Management and Planning Tools solution.- Hr Recruitment Responsibilities
- Hr Authority Matrix Example
- Hr Organizational Chart Diagram
- How to Create a HR Process Flowchart Using ConceptDraw PRO ...
- Responsibility Matrix To Seven Members Of A Software Product
- Hr Strategy Evaluation Process Diagram
- Basic Flowchart Symbols and Meaning | How to Create a HR ...
- HR Management Software | Organizational Structure | Legal Timeline
- Organizational Structure | HR Management Software | UML Diagram ...
- Cross Functional Flowchart Symbols | HR Flowchart Symbols | Basic ...
- Job Description Flow Chart
- Responsibility Assignment Matrix Template
- Show The Hr Organizational Chart In A Large Firm With Diagram
- Brief Hr Design Reporting Organization Chart Template Word
- Organizational Charts | How to Create a HR Process Flowchart ...
- HR Flowchart Symbols | How to Create a HR Process Flowchart ...
- Decision Making Diagram In Hr
- Types of Flowchart - Overview | Process Flowchart | Basic Flowchart ...
- HR Flowchart Symbols | Basic Flowchart Symbols and Meaning ...
