HelpDesk
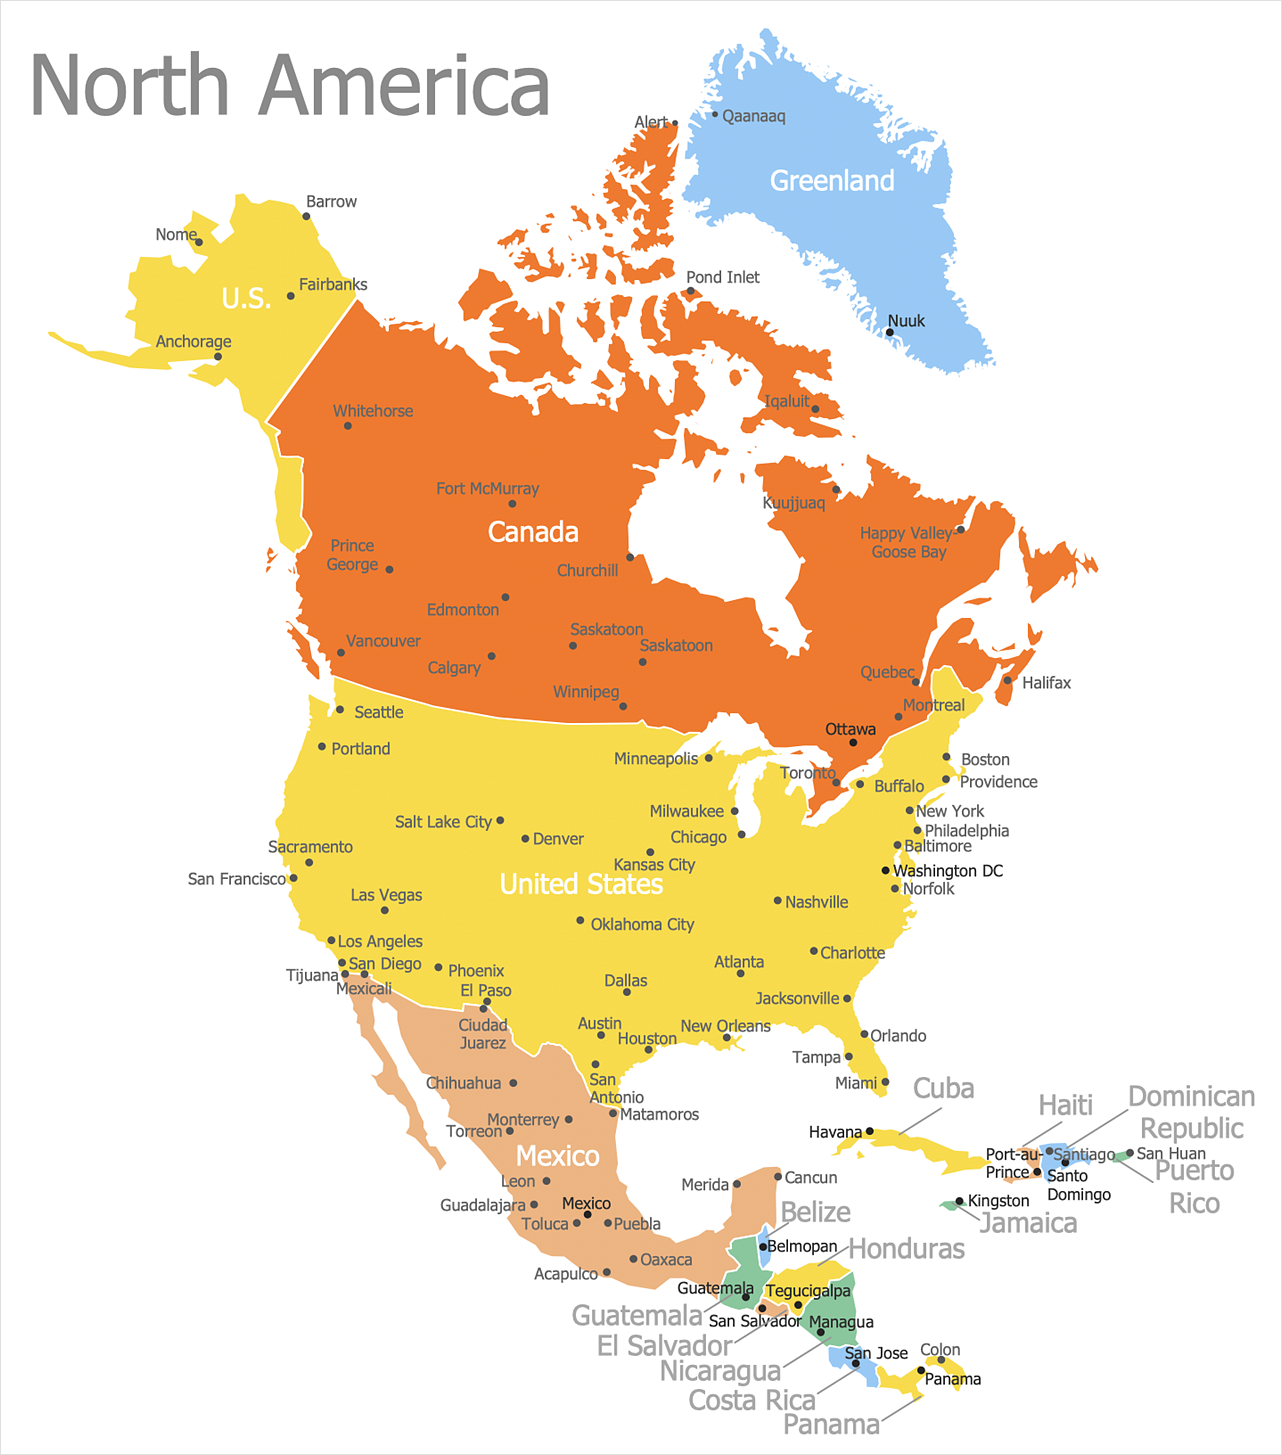
How to Draw a Map of North America
Geographic maps, cardiograms, and thematic maps are often used for geographical visualization of business information. Any country can inspire a wealth of geopolitical statistical data. A common way of assimilating this data is to create maps that convey a particular theme or subject matter in relation to a specific geographical area. Known as thematic maps, they cover themes such as population density, average rainfall, or political allegiance, differentiating the data by using graphical elements and annotation. Thematic maps contrast general reference maps, which tend to display information on a variety of subjects — vegetation, topology, roads, and highways, for example. A thematic map will always focus on one particular subject matter. ConceptDraw DIAGRAM can be helpful as a tool for creating maps of countries and regions of the world. It allows you to draw continental maps quickly and easily using the special templates and vector stencils libraries.Draw Diagram on Mac
Professional diagramming software for mac helps you create Cause and Effect diagram known as Fishbone diagram or Ishikawa diagram from ConceptDraw Business Solution. You will be offered to use templates, samples or draw your diagram using ConceptDraw Arrows10 TechnologyBusiness diagrams & Org Charts with ConceptDraw DIAGRAM
The business diagrams are in great demand, they describe the business processes, business tasks and activities which are executed to achieve specific organizational and business goals, increase productivity, reduce costs and errors. They let research and better understand the business processes. ConceptDraw DIAGRAM is a powerful professional cross-platform business graphics and business flowcharting tool which contains hundreds of built-in collections of task-specific vector stencils and templates. They will help you to visualize and structure information, create various Business flowcharts, maps and diagrams with minimal efforts, and add them to your documents and presentations to make them successful. Among them are Data flow diagrams, Organization charts, Business process workflow diagrams, Audit flowcharts, Cause and Effect diagrams, IDEF business process diagrams, Cross-functional flowcharts, PERT charts, Timeline diagrams, Calendars, Marketing diagrams, Pyramids, Target diagrams, Venn diagrams, Comparison charts, Analysis charts, Dashboards, and many more. Being a cross-platform application, ConceptDraw DIAGRAM is very secure, handy, free of bloatware and one of the best alternatives to Visio for Mac users.
 SYSML
SYSML
The SysML solution helps to present diagrams using Systems Modeling Language; a perfect tool for system engineering.
Best Tool for Infographic Construction
ConceptDraw is a best data visualization tool that will allow everyone to create rich infographics and visualizations quickly and easily.- Block Diagram Geography
- Process And Geographical Management Block Diagram
- Block Diagram In Geography
- How To Draw Block Diagram In Uml
- Draw Block Diagram Communication System Osx
- Spatial Data Analysis | How to Draw Pictorial Chart . How to Use ...
- Flow Diagrams Of Geography
- Geography Diagram Program
- Software For Drawing Geography Diagrams
- Basic Diagramming | Simple Diagramming | Simple Drawing ...
- Diagram Of Nature In Geography
- Engineering | Block Diagrams | Universal Diagramming Area ...
- Basic Diagramming | Block Diagrams | Universal Diagramming Area ...
- Process Flowchart | Block Diagrams | Basic Flowchart Symbols and ...
- Geo Map - Africa | How to Draw Pictorial Chart . How to Use ...
- Beautiful Nature Scene: Drawing | Map of Continents | Map Software ...
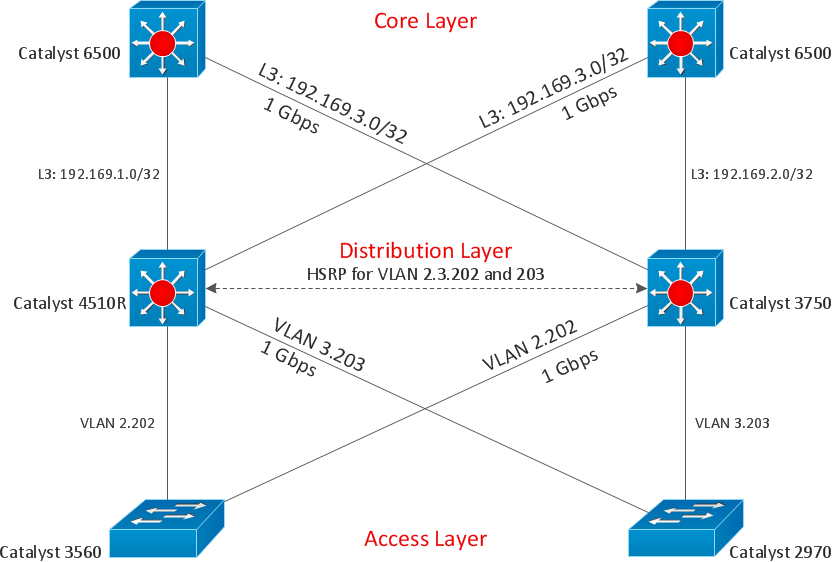
- Diagrams Of Lan Wan Man Networks
- Block Diagrams | Telecommunication Network Diagrams | Network ...
- Block Diagram | Process Flowchart | Block Diagram Creator | Block ...


