 Fault Tree Analysis Diagrams
This solution extends ConceptDraw PRO v9.5 or later with templates, fault tree analysis example, samples and a library of vector design elements for drawing FTA diagrams (or negative analytical trees), cause and effect diagrams and fault tree diagrams.
This example was redesigned from the Wikimedia Commons file: Example of High Level Fault Tree.jpg. [commons.wikimedia.org/ wiki/ File:Example_ of_ High_ Level_ Fault_ Tree.jpg]
"Risk assessment is the determination of quantitative or qualitative value of risk related to a concrete situation and a recognized threat (also called hazard). Quantitative risk assessment requires calculations of two components of risk (R):, the magnitude of the potential loss (L), and the probability (p) that the loss will occur. Acceptable risk is a risk that is understood and tolerated usually because the cost or difficulty of implementing an effective countermeasure for the associated vulnerability exceeds the expectation of loss.
In all types of engineering of complex systems sophisticated risk assessments are often made within Safety engineering and Reliability engineering when it concerns threats to life, environment or machine functioning. The nuclear, aerospace, oil, rail and military industries have a long history of dealing with risk assessment. Also, medical, hospital, social service and food industries control risks and perform risk assessments on a continual basis. Methods for assessment of risk may differ between industries and whether it pertains to general financial decisions or environmental, ecological, or public health risk assessment." [Risk assessment. Wikipedia]
The FTA diagram example "High level fault tree" was created using the ConceptDraw PRO diagramming and vector drawing software extended with the Fault Tree Analysis Diagrams solution from the Engineering area of ConceptDraw Solution Park.
FTA diagram

Graphics Software for Business
 diagram")
Process Flowchart


 Specification and Description Language (SDL)
For people in the field of systems engineering or system design, working with specification and description language (sdl) and finite state machines (fsm).
 GHS Hazard Pictograms
GHS Hazard Pictograms solution contains the set of predesigned standard GHS pictograms, Hazardous symbols, and Hazard communication pictograms, approved and agreed by UN in Globally Harmonized System of Classification and Labelling of Chemicals (GHS). They can be used for quick and simple designing accurate and professional-looking infographics, diagrams, warning announcements, signboards, posters, precautionary declarations, regulatory documents, and for representing the main items of OSHA HAZCOM Standard.
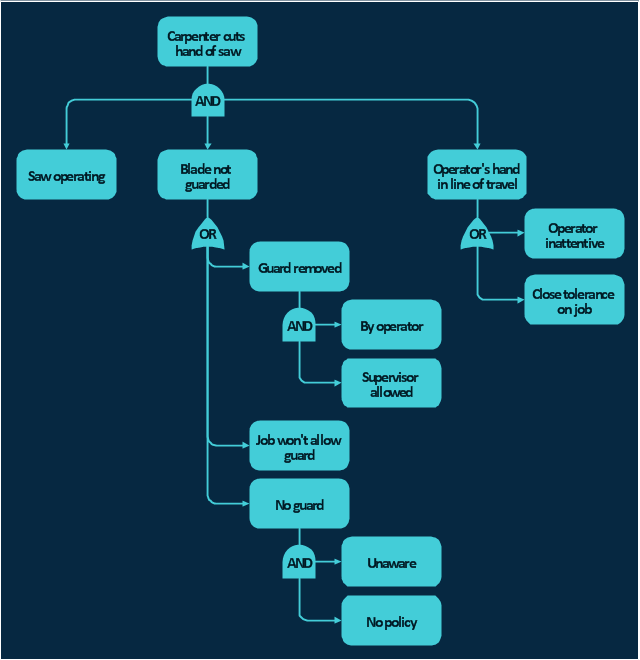
The FTA diagram example "Hazard analysis" was redesigned from the illustration of the article "Hazard Analysis Methodologies" from the Occupational Safety & Health Administration (OSHA) website.
"A fault tree analysis is a quantitative assessment of all of the undesirable outcomes, such as a toxic gas release or explosion, which could result from a specific initiating event. It begins with a graphic representation (using logic symbols) of all possible sequences of events that could result in an incident. The resulting diagram looks like a tree with many branches — each branch listing the sequential events (failures) for different independent paths to the top event. Probabilities (using failure rate data) are assigned to each event and then used to calculate the probability of occurrence of the undesired event. ...
This technique is particularly useful in evaluating the effect of alternative actions on reducing the probability of occurrence of the undesired event."
[osha.gov/ SLTC/ etools/ safetyhealth/ mod4_ tools_ methodologies.html]
The FTA diagram example "Hazard analysis" was created using the ConceptDraw PRO diagramming and vector drawing software extended with the Fault Tree Analysis Diagrams solution from the Engineering area of ConceptDraw Solution Park.
FTA diagram
Decision Making Software For Small Business


 Cisco Network Diagrams
Cisco Network Diagrams solution extends ConceptDraw PRO with the best characteristics of network diagramming software. Included samples, templates and libraries of built-in standardized vector Cisco network icons and Cisco symbols of computers, network devices, network appliances and other Cisco network equipment will help network engineers, network designers, network and system administrators, as well as other IT professionals and corporate IT departments to diagram efficiently the network infrastructure, to visualize computer networks topologies, to design Cisco computer networks, and to create professional-looking Cisco Computer network diagrams, Cisco network designs and schematics, Network maps, and Network topology diagrams in minutes.
, t chart, decision matrix, decision tree analysis") Decision Making
Decision Making
The Decision Making solution offers the set of professionally developed examples, powerful drawing tools and a wide range of libraries with specific ready-made vector decision icons, decision pictograms, decision flowchart elements, decision tree icons, decision signs arrows, and callouts, allowing the decision maker (even without drawing and design skills) to easily construct Decision diagrams, Business decision maps, Decision flowcharts, Decision trees, Decision matrix, T Chart, Influence diagrams, which are powerful in questions of decision making, holding decision tree analysis and Analytic Hierarchy Process (AHP), visual decomposition the decision problem into hierarchy of easily comprehensible sub-problems and solving them without any efforts.
- High level fault tree | Design Element: Rack Diagram for Network ...
- FTA diagram - Hazard analysis | Fault Tree Analysis Diagrams ...
- Fault Tree Calculation Example
- Fault Tree Analysis Diagrams | Root cause analysis tree diagram ...
- Audit failure - Fault tree analysis diagram
- Fault Tree Analysis Visio Sample
- Draw Fault Tree Analysis Online
- FTA diagram - Hazard analysis | Accident analytic tree - FTA ...
- Fault Tree Analysis Examples And Solutions
- Qualitative Risk Assessment Template