HelpDesk
How to Make a Workflow Diagram Using ConceptDraw PRO
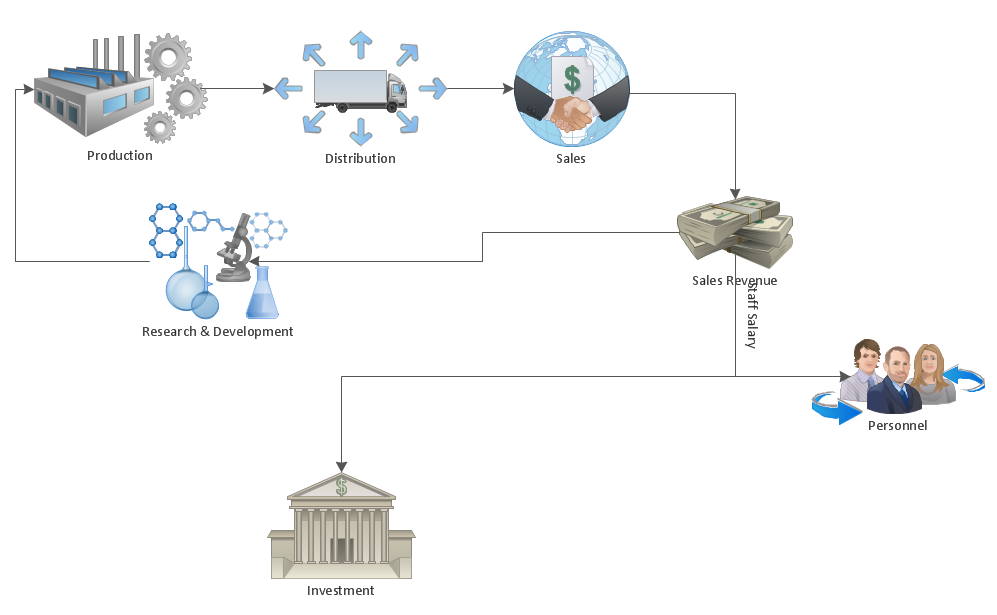
With the help of a workflow diagram you can visually describe the tasks, documents, people responsible for execution at each stage of workflow. Modern workflow diagrams have a specific focus on quality control. This can apply to the quality of inputs and outputs related to a process, or to the actual efficiency of the workflow itself. Different sectors of business use different diagramming techniques, and this has given rise to a number of methods that have become recognized in their own right as industry standards. ConceptDraw PRO, with the Workflow Diagrams solution, is ideal for creating diagrams of this type. Its RapidDraw technology takes the strain from diagram arrangement, allowing users to create their process steps with a single click, ideal for generating the many repeatable tasks that can make up a workflow. The Workflow Diagrams solution complements this feature with a library of selected icons to represent various steps.HelpDesk
How to Create a BPMN Diagram Using ConceptDraw PRO
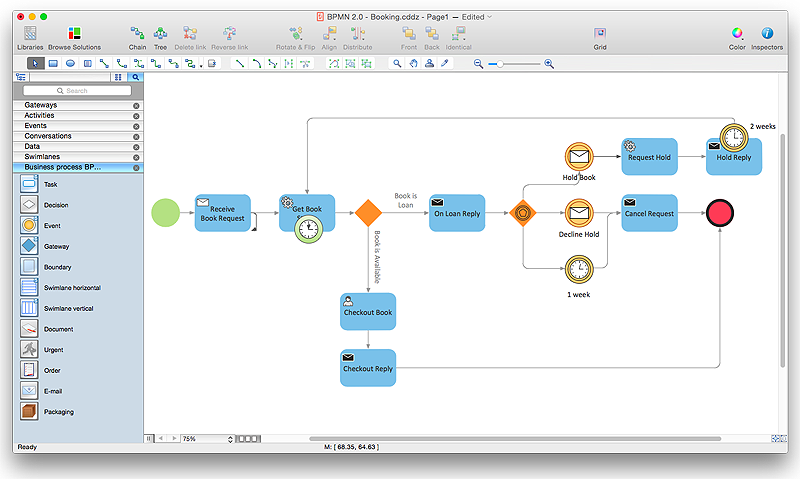
Business Process Modeling Notation (BPMN) is a method of illustrating business processes in the form of a diagram. The most effective method of creating or analyzing a business process is to visually interpret the steps using a business process diagram, flowchart or workflow. This is known as business process modeling, and will be performed within a company by a team who have detailed knowledge of company process, and analysts with expertise in the modeling discipline. The objective is often to increase production or lower costs — by modeling the process initially using a flowchart, inefficiencies and problems can be spotted before committing to a decision or strategy. You can create BPMN diagrams using the ConceptDraw PRO diagramming tools. ConceptDraw have designed a solution that combines BPMN v2.0 methodology and graphical notification into one powerful package. The Business Process Diagrams solution from ConceptDraw Solution Park provides a comprehensive collection of vectorDiagramming Software for designing UML Sequence Diagrams
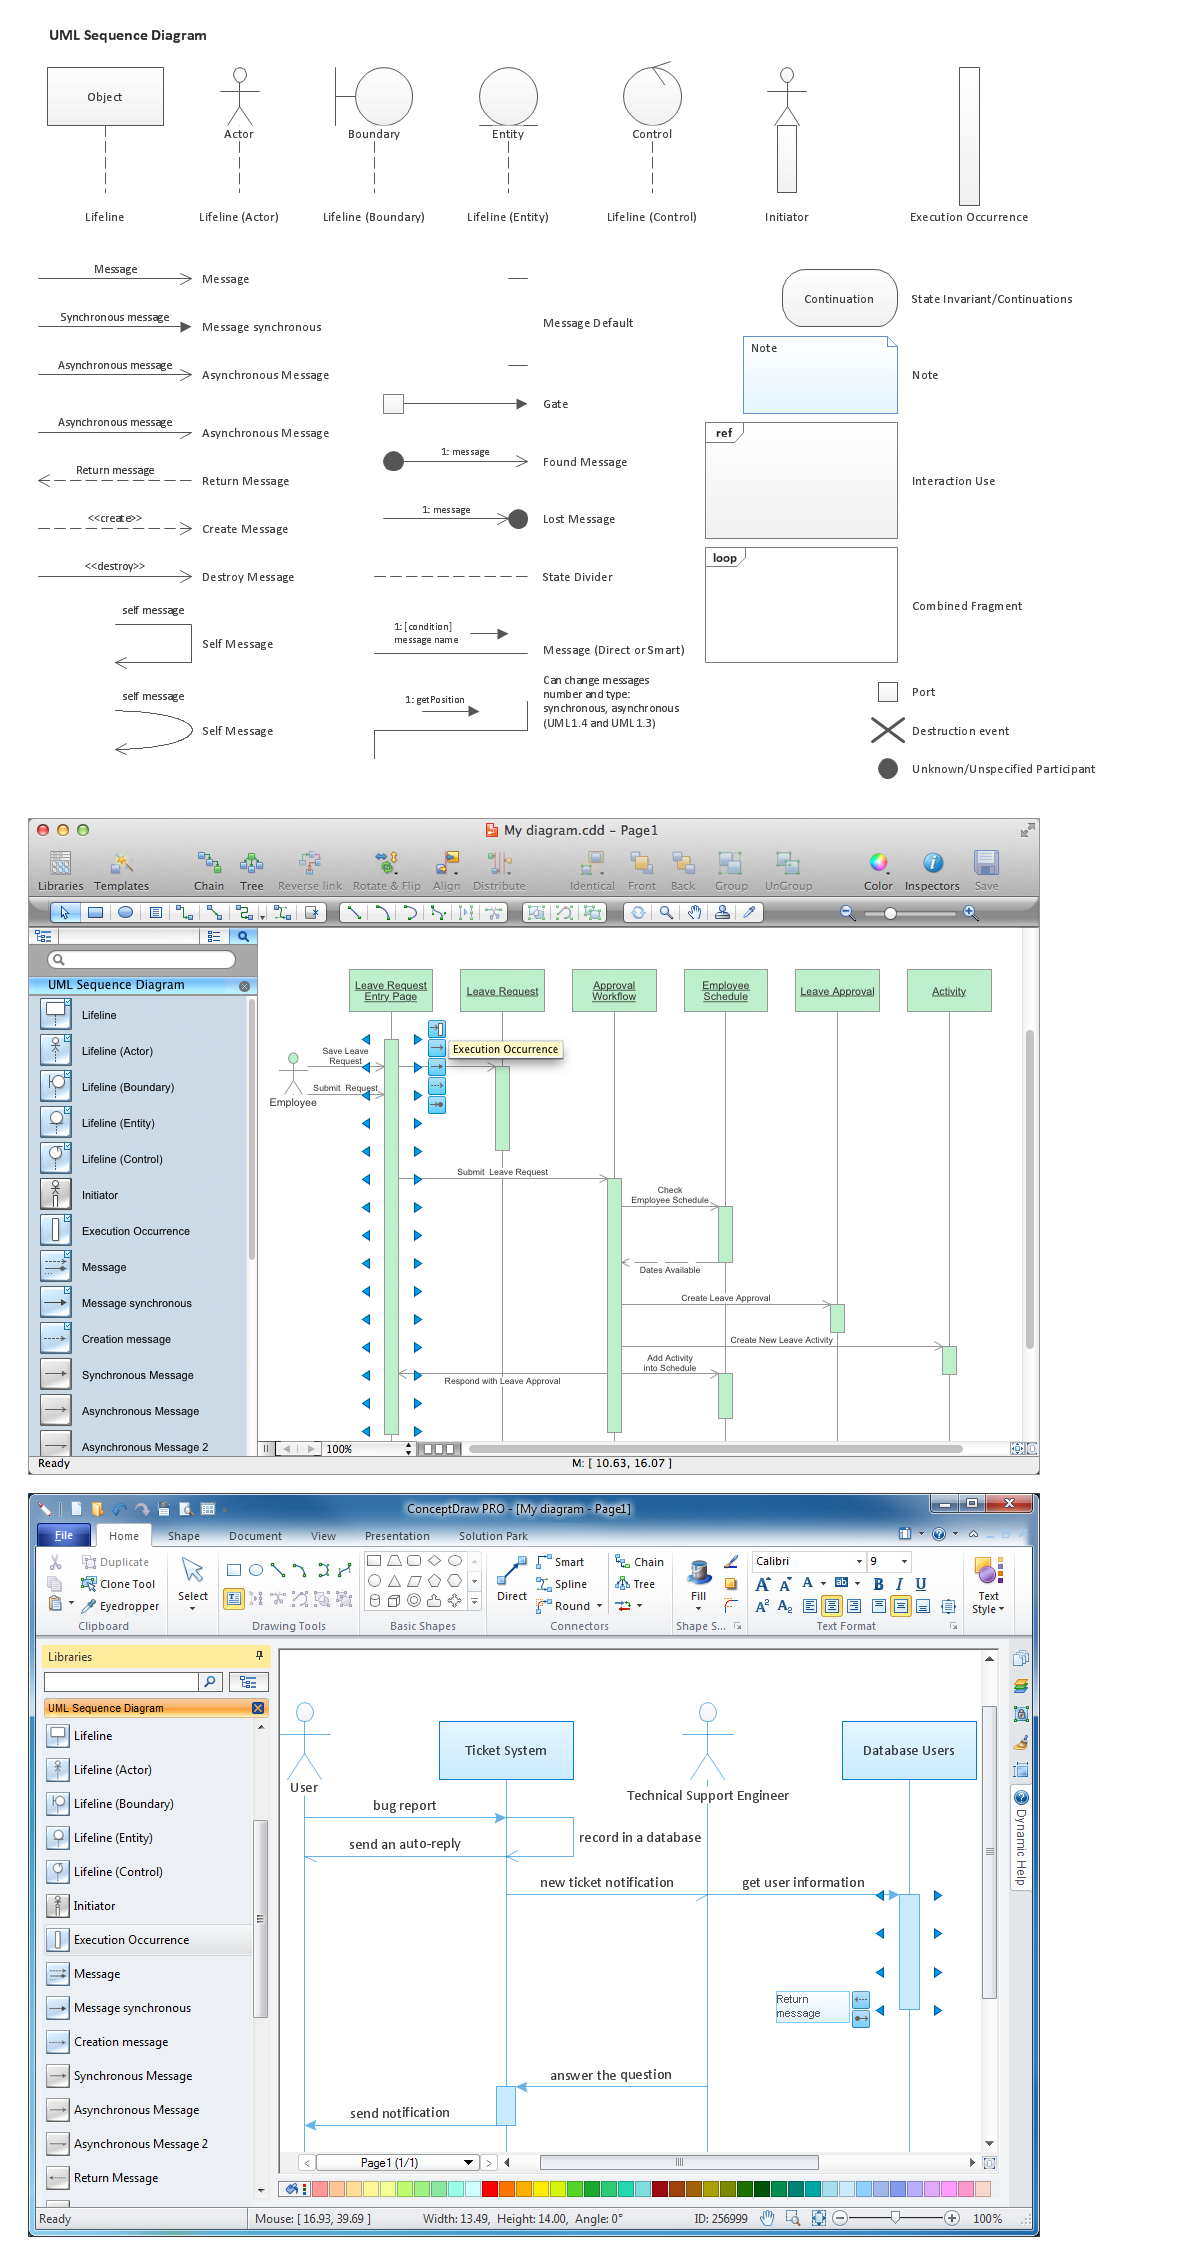
Sequence Diagrams shows how objects communicate with each other in terms of a sequence of messages. Also indicates the lifespans of objects relative to those messages.
HelpDesk
How to Create a Bubble Diagram Using ConceptDraw PRO
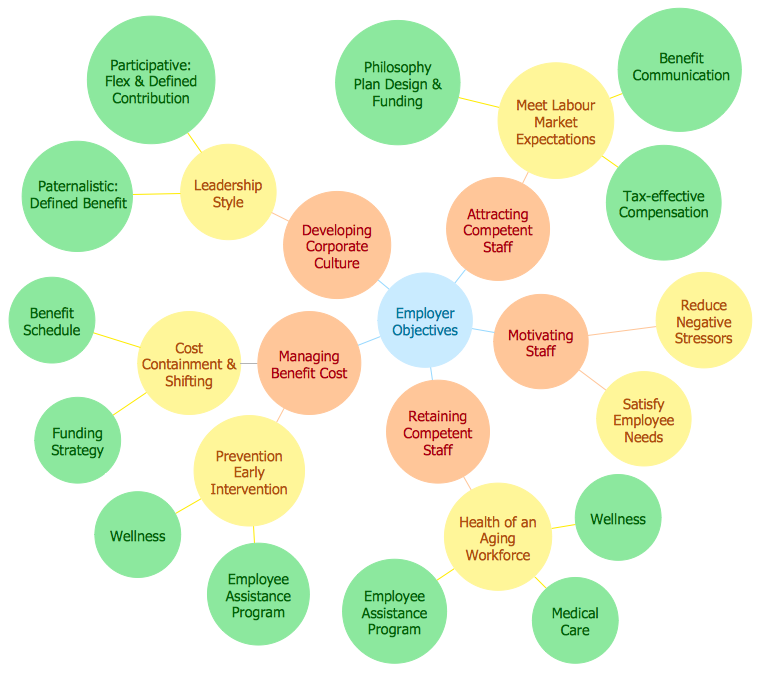
Bubble Diagram is a simple chart that consists of circles (bubbles) repesening certain topics or processes. Bubbles are connected by lines depicting the type of relationships between the bubbles. The size of each bubble is depended on the importance of the entity it represents. Bubble charts are widely used throughout social, economical, medical, and other scientific researches as well as throughout architecture and business management. Bubble charts are often used during the early stages of product development to visualize thoughts and ideas for the purpose of sketching out a development plan. ConceptDraw PRO allows you to draw a bubble diagrams using the Bubble Diagrams solution.HelpDesk
Download and Install ConceptDraw Office on Mac
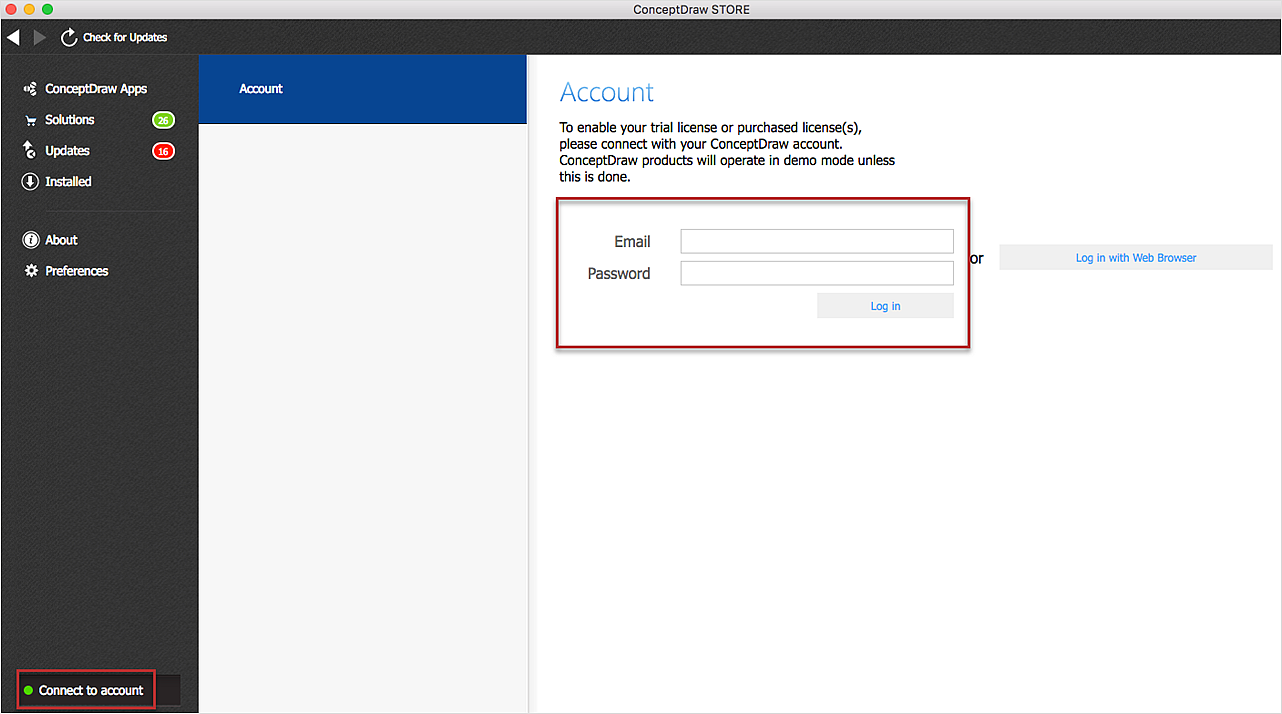
Find out how to download and install ConceptDraw software products for OS X on your computer. The download process is very simple due to the fact that all ConceptDraw applications are pooled into the ConceptDraw Office bundle. ConceptDraw Solution Browser is a download manager that is responsible for downloading, installing, uninstalling and updating of the ConceptDraw Office for Windows and associated solutions.HelpDesk
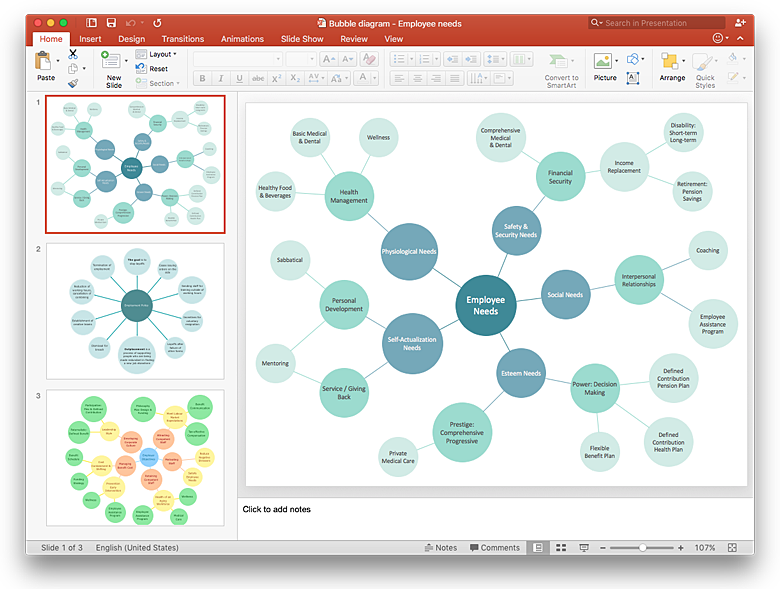
How to Add a Bubble Diagram to a PowerPoint Presentation Using ConceptDraw PRO
Bubble diagrams can be used to compare concepts, and identify areas of similarity and difference. ConceptDraw PRO allows you to make a MS PowerPoint Presentation from your charts in a few simple steps.HelpDesk
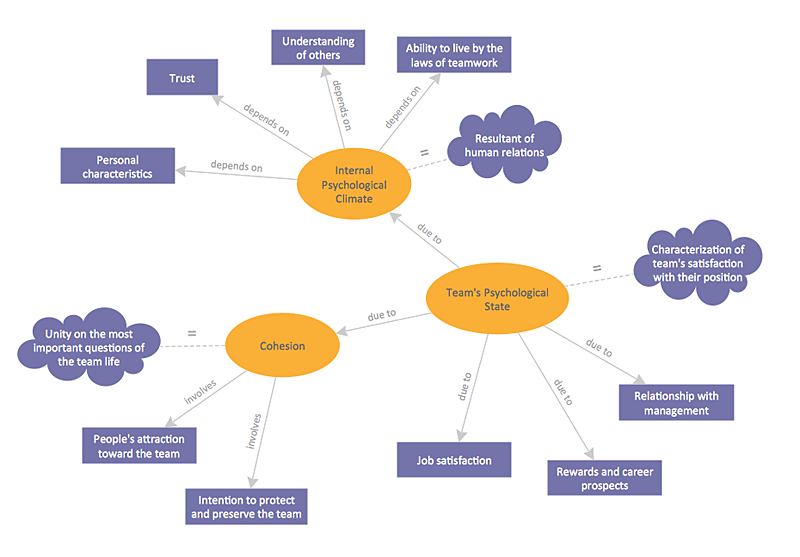
How to Create a Concept Map in ConceptDraw PRO
Graphical technique of knowledge representation in a form of structured networks of concepts (ideas) is called concept mapping. Concept network consists of shapes that represent concepts and connectors representing relationships between concepts. The difference between mind maps and concept maps is that a mind map has only one object depicting a main idea , while a concept map may have several. Concept mapping is used to structure ideas, to communicate complex system of knowledge, to help learning process, etc. ConceptDraw PRO allows you to draw concept maps using the Concept Map solution.HelpDesk
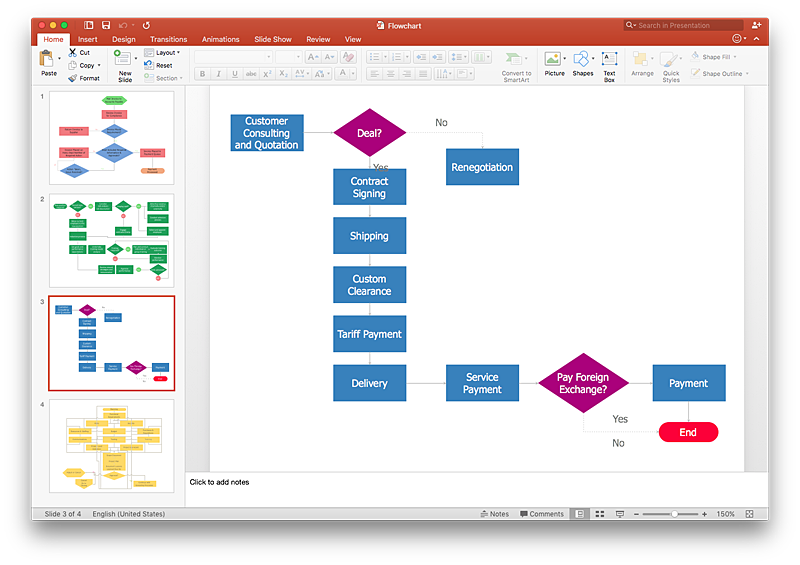
How To Make a PowerPoint Presentation of Flowcharts Using ConceptDraw PRO
ConceptDraw PRO allows you to create professional flowchart quickly and easily. The ability to create flowcharts is contained in the Flowcharts solution. To submit flowcharts for the audience, you can use export to MS PowerPoint.HelpDesk
How to Draw a Circular Arrows Diagram Using ConceptDraw PRO
The cyclic recurrence is a fundamental property of multiple systems. The cycle is a process which consists from elements (phases, stages, stages) following each other. Many processes in astronomy, biology, chemistry, physics, mathematics, etc. have a cycle properties. It is also widely used in information technologies and marketing analysis. Graphical representation of cyclic processes can have many forms. It can be a circle, parabola, hyperbola, ellipse and others. A Circular Arrows Diagram is used as one of the statistical charts in the business, mass media and marketing. ConceptDraw PRO provides its users tools for making easy drawing Circular Arrows Diagrams.HelpDesk
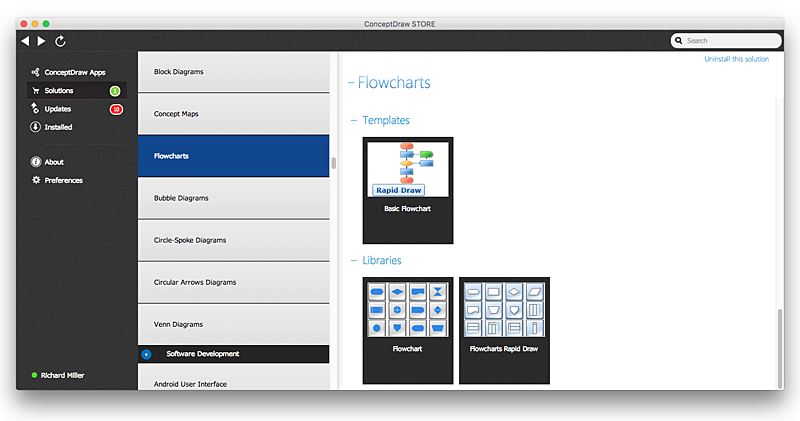
Flowchart Software Free Download
Making flowchart is an easiest way to depict any typical process. Any complex process, consisting from standard components can be displayed as a Flowchart. ConceptDraw PRO is proved to be a simple and easy tool for creating flowcharts. It does not require the skills of a professional designer. Making flowchart to map any process you will see the ways of its optimization and improvement. Flowchart software is here and you can download it for free.HelpDesk
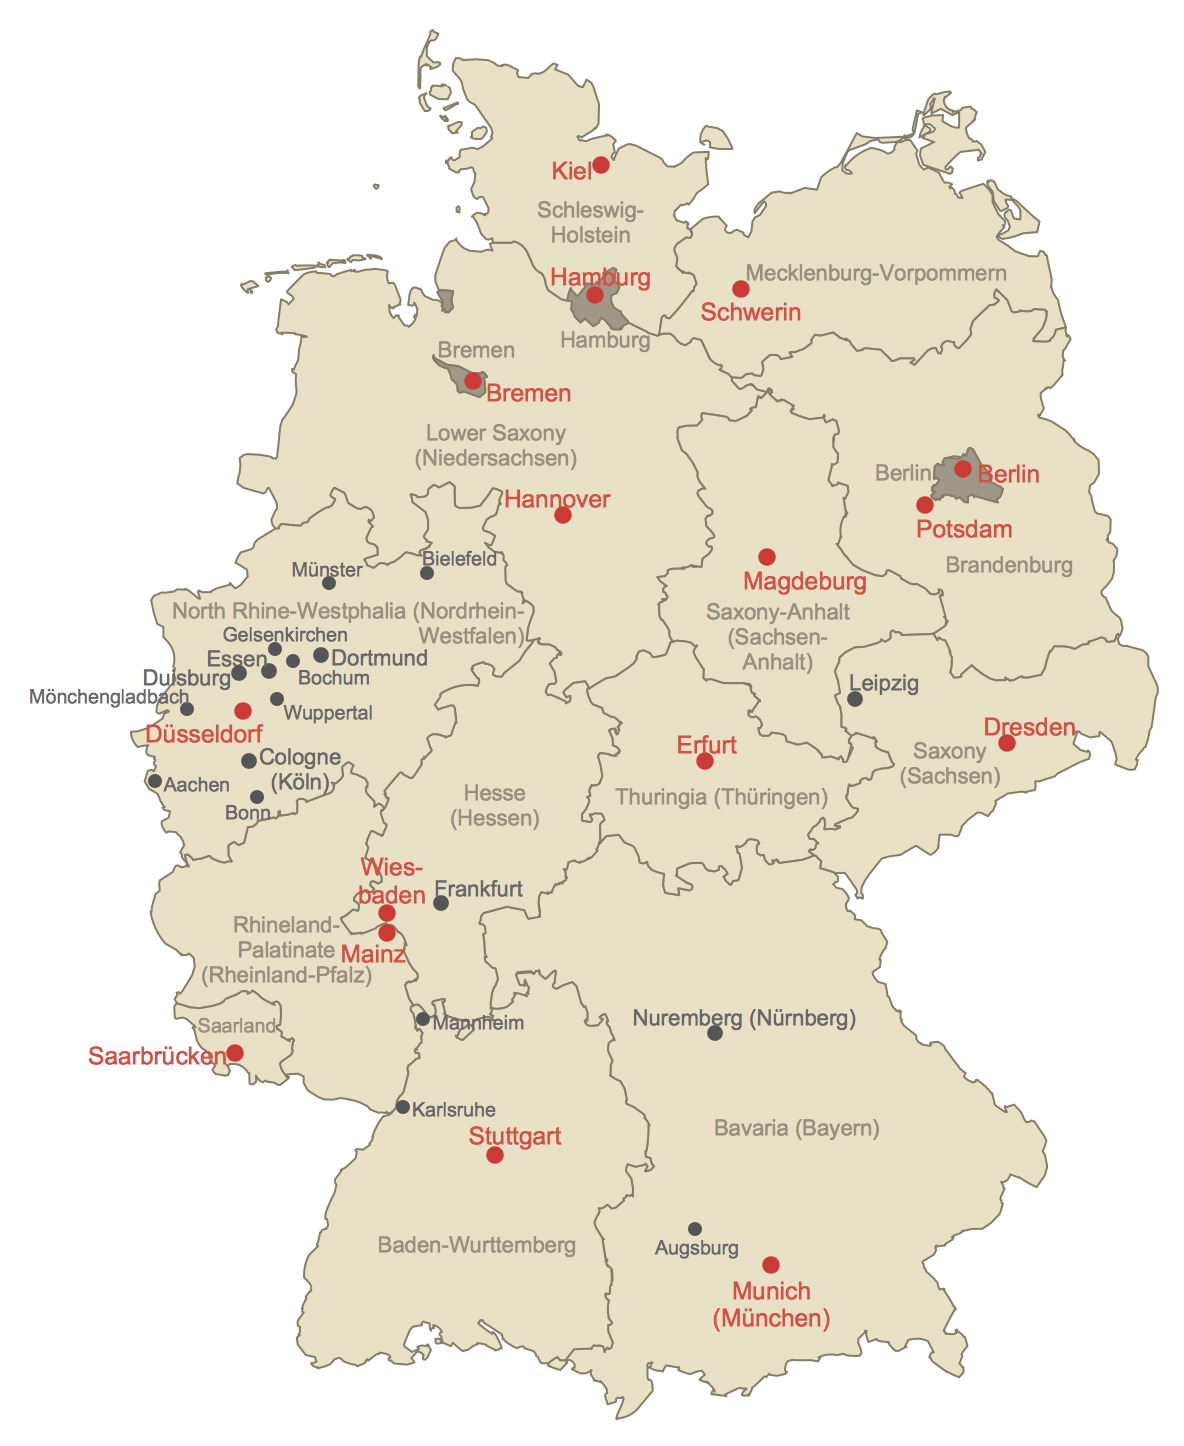
How to Create a Map of Germany Using ConceptDraw PRO
Geographical thematic maps are used to display information on a variety of subjects. It is a common way of representing any form of spatial data in relation to a specific geographical area. The Germany Map Solution for ConceptDraw PRO includes all of the German federal states with county outlined borders and major cities. You can quickly create geographic maps, cartograms, and thematic maps for geographical visualization information for business and travels.HelpDesk
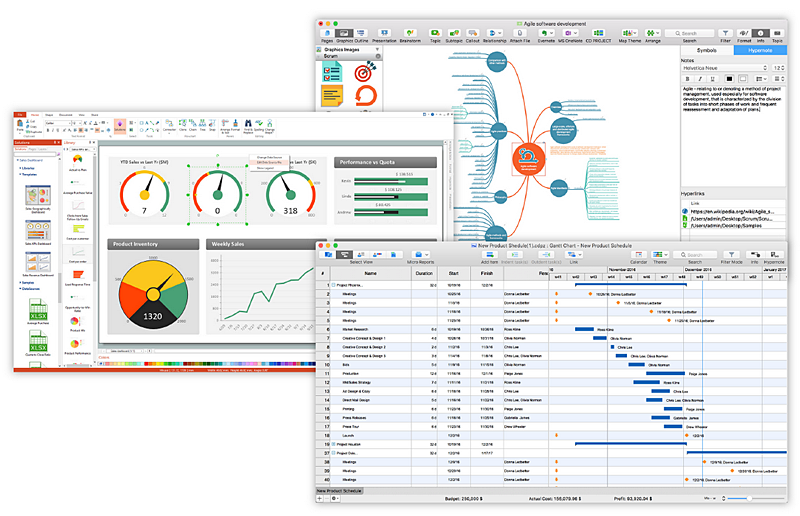
How to Upgrade ConceptDraw Office vv1-2
Since CS Odessa Introduced ConceptDraw Office v3 – A Powerful Collection of ConceptDraw Productivity and Project Applications for Mac and PCC, any customer who has previously purchased ConceptDraw Office vv.1,2 products is eligible for upgrade pricing. Owners of previous versions can upgrade their applications to the latest release.HelpDesk
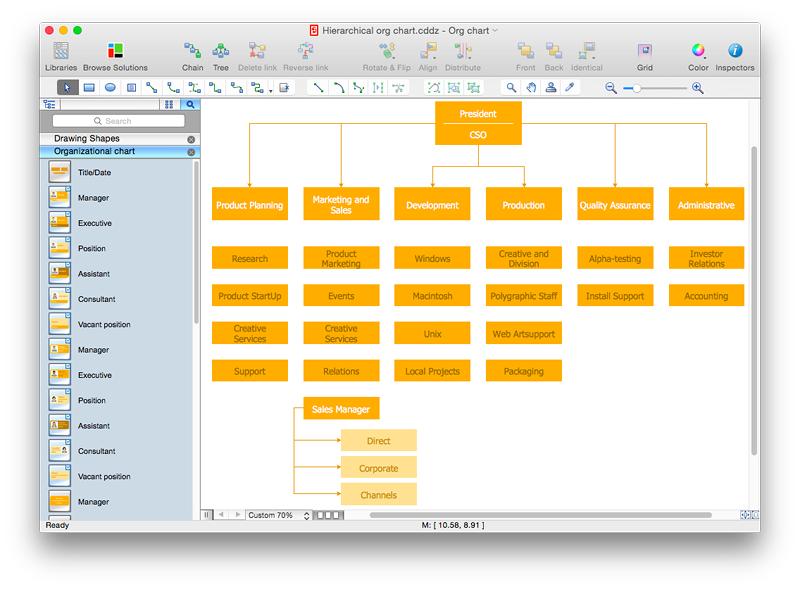
How to Draw a Hierarchical Organizational Chart with ConceptDraw PRO
There are a number of different organisational structures. The most appropriate structure will depend on the size of the business and the type of business. A hierarchical organizational structure is one of the most typical organizational structure. This structure can be represented as a pyramid, with a single entity in authority at the top, with subsequent levels of power beneath them. Each member of the pyramid reports only to their direct subordinates or superiors, limiting the amount of communication overhead, which can be seen both as an asset or a limitation. It is easy to see where a hierarchical structure would be an effective solution; companies that have offices based in disparate locations, a business that focuses on diversified markets, any organization with need for multiple levels of middle management. You can easily create a clear hierarchical organizational chart using ConceptDraw solution that contains templates of the 25 Typical Orgcharts.HelpDesk
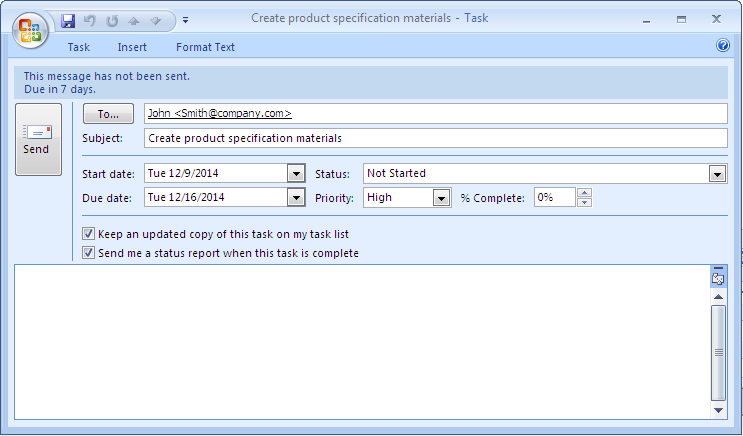
How to Send Task From a Mind Map to MS Outlook
ConceptDraw MINDMAP v8 supports integration with MS Outlook. The mind map topic can be transformed into MS Outlook message.- Product Request Form Template
- Create Printable Form
- Order Request
- Flow chart Example. Warehouse Flowchart | 5s Form
- Order Form Format
- Form Maker | New business opportunity SWOT analysis matrix ...
- Bpmn It Help Desk
- How to Create SWOT Analysis Template Using ConceptDraw PRO ...
- Software Request Form Template
- Service Request Workflow Diagram
- IDEF3 Standard | How to create an IDEF3 diagram using ...
- Business process diagram BPMN 1.2 - Hiring process
- Order Form Example
- Project plan timeline - Request for proposal (RFP) | Project timeline ...
- Service Request Template
- Request For Technology Form
- How To Create a MS Visio Business Process Diagram Using ...
- Basic Flowchart Symbols and Meaning | Audit Flowchart Symbols ...
- How To Create an Involvement Matrix | Matrix Organization Structure ...
