Design Pictorial Infographics. Design Infographics

HelpDesk
How to Create Infographics that Help People Eat Healthy

 Health Food
The Health Food solution contains the set of professionally designed samples and large collection of vector graphic libraries of healthy foods symbols of fruits, vegetables, herbs, nuts, beans, seafood, meat, dairy foods, drinks, which give powerful possi
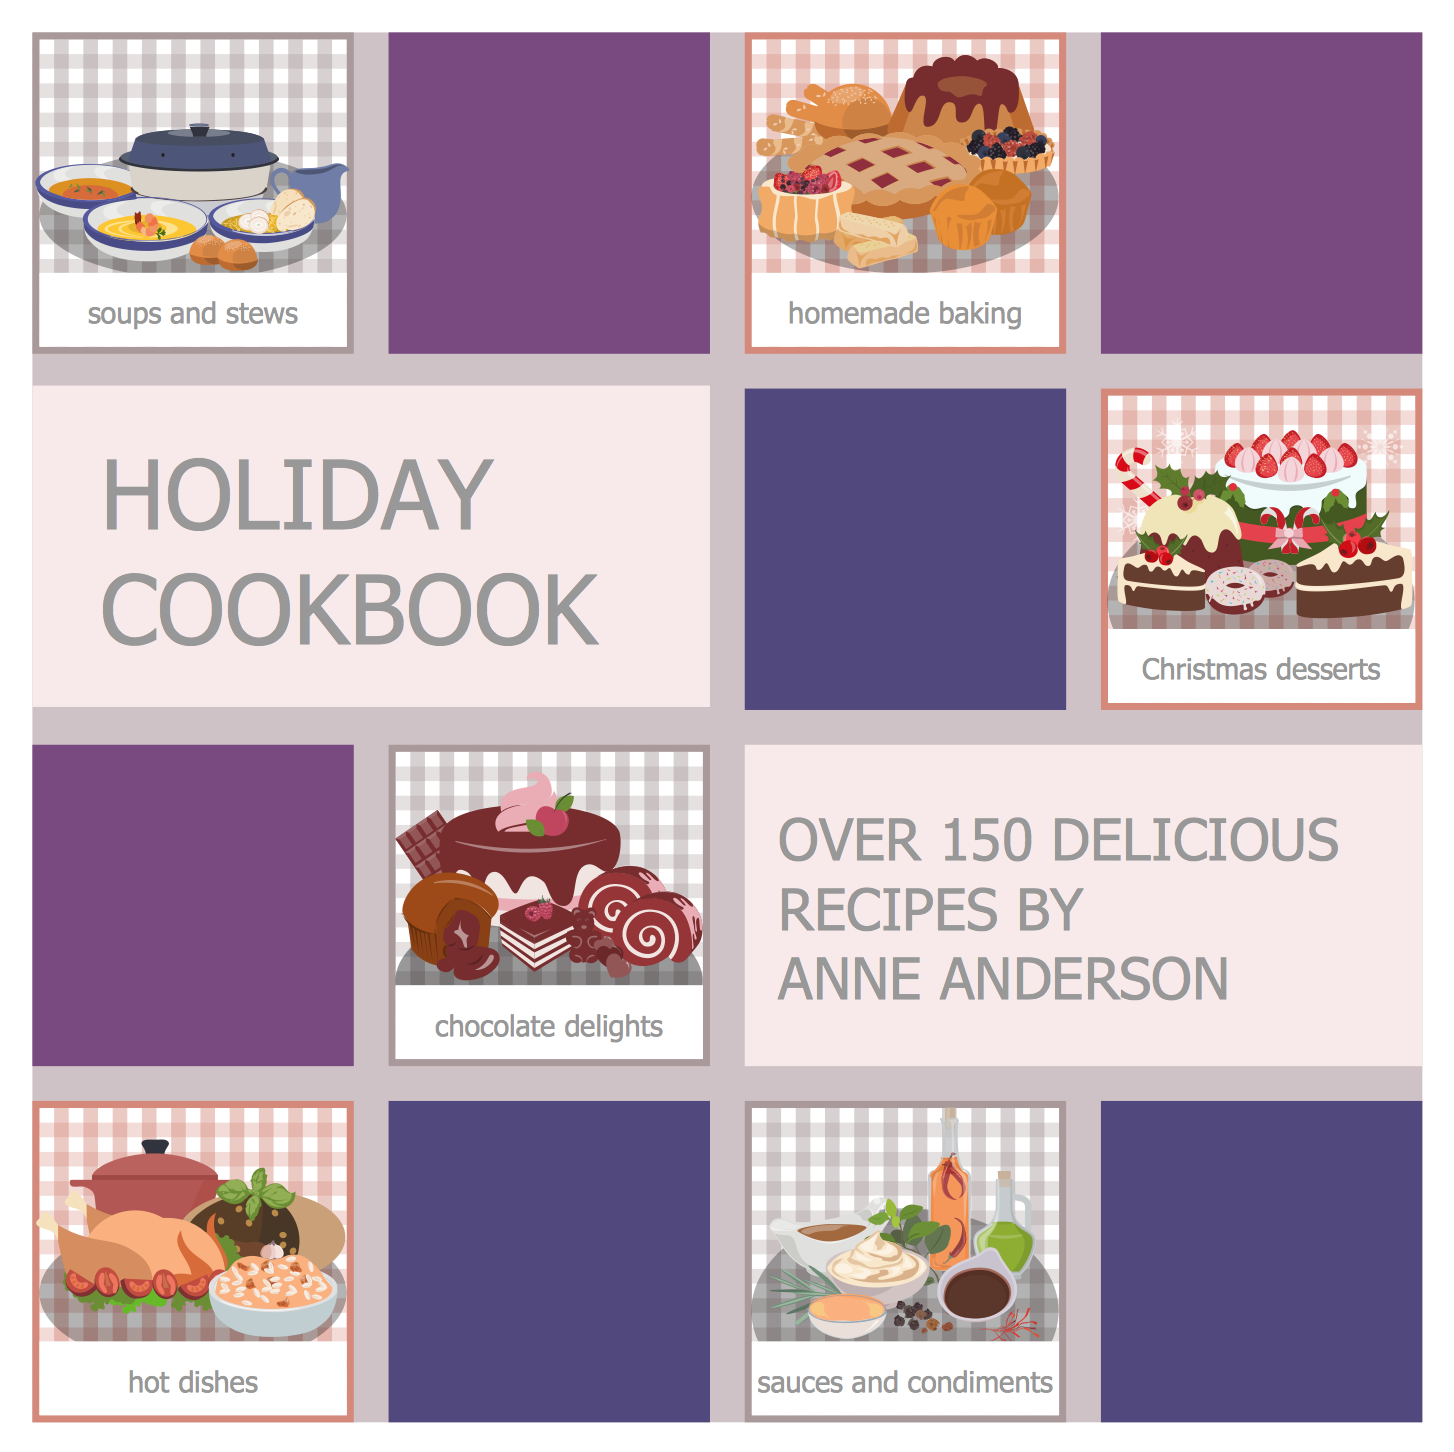
Holiday Recipes
 Picture Graphs
Typically, a Picture Graph has very broad usage. They many times used successfully in marketing, management, and manufacturing. The Picture Graphs Solution extends the capabilities of ConceptDraw DIAGRAM with templates, samples, and a library of professionally developed vector stencils for designing Picture Graphs.
 Pie Charts
Pie Charts are extensively used in statistics and business for explaining data and work results, in mass media for comparison (i.e. to visualize the percentage for the parts of one total), and in many other fields. The Pie Charts solution for ConceptDraw DIAGRAM offers powerful drawing tools, varied templates, samples, and a library of vector stencils for simple construction and design of Pie Charts, Donut Chart, and Pie Graph Worksheets.
 ConceptDraw Solution Park
ConceptDraw Solution Park collects graphic extensions, examples and learning materials
 Area Charts
Area Charts are used to display the cumulative totals over time using numbers or percentages; or to show trends over time among related attributes. The Area Chart is effective when comparing two or more quantities. Each series of data is typically represented with a different color, the use of color transparency in an object’s transparency shows overlapped areas and smaller areas hidden behind larger areas.
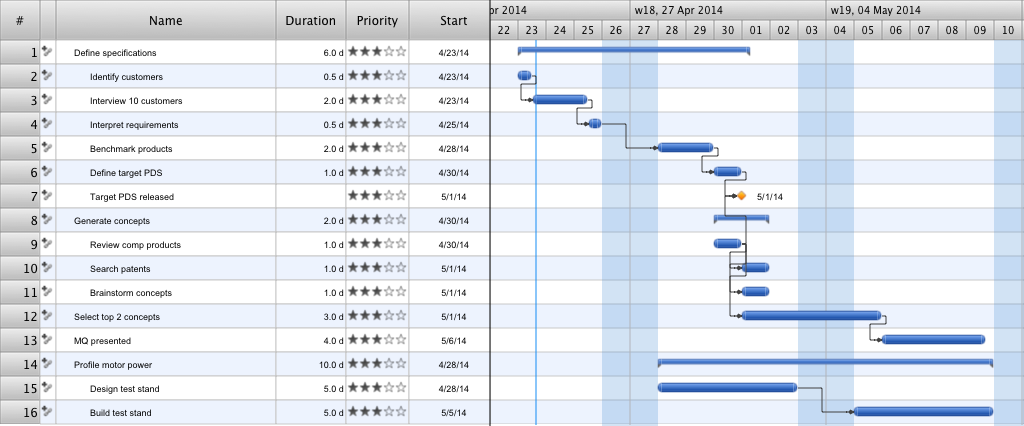
Gantt Chart Templates
 Bar Graphs
The Bar Graphs solution enhances ConceptDraw DIAGRAM functionality with templates, numerous professional-looking samples, and a library of vector stencils for drawing different types of Bar Graphs, such as Simple Bar Graph, Double Bar Graph, Divided Bar Graph, Horizontal Bar Graph, Vertical Bar Graph, and Column Bar Chart.
 Aerospace and Transport
This solution extends ConceptDraw DIAGRAM software with templates, samples and library of vector clipart for drawing the Aerospace and Transport Illustrations. It contains clipart of aerospace objects and transportation vehicles, office buildings and anci
 Venn Diagrams
Venn Diagrams are actively used to illustrate simple set relationships in set theory and probability theory, logic and statistics, mathematics and computer science, linguistics, sociology, and marketing. Venn Diagrams are also often used to visually summarize the status and future viability of a project.
 Marketing Diagrams
Marketing Diagrams solution extends ConceptDraw DIAGRAM diagramming software with abundance of samples, templates and vector design elements intended for easy graphical visualization and drawing different types of Marketing diagrams and graphs, including Branding Strategies Diagram, Five Forces Model Diagram, Decision Tree Diagram, Puzzle Diagram, Step Diagram, Process Chart, Strategy Map, Funnel Diagram, Value Chain Diagram, Ladder of Customer Loyalty Diagram, Leaky Bucket Diagram, Promotional Mix Diagram, Service-Goods Continuum Diagram, Six Markets Model Diagram, Sources of Customer Satisfaction Diagram, etc. Analyze effectively the marketing activity of your company and apply the optimal marketing methods with ConceptDraw DIAGRAM software.
 HR Flowcharts
Human resource management diagrams show recruitment models, the hiring process and human resource development of human resources.
- Healthy Foods | Drawing Images Of Chart Of Balanced Diet
- Healthy Food Chart With Images
- Healthy Diet Plan | Healthy Diet | Healthy Food Recipes | Balanced ...
- Food Court | Food Pictures | Health Food | Chart Of Fruit And ...
- Images Of Full Chart Of Healthy Food
- Healthy Diet Plan | Food Pictures | Healthy Foods | Picture Chart On ...
- Healthy Diet Plan | Healthy Diet | Food Pictures | Image Of Balance ...
- Healthy Food Ideas | Healthy Foods | Restaurant Floor Plans ...
- Healthy Food Picture Chart
- Healthy Diet Plan | Healthy Food Recipes | Health Food | A Chart On ...
- Healthy Diet Plan | Healthy Diet | Healthy Food Ideas | Balanced ...
- Images For Balance Diet Chart Project
- Idea Of Healthy Food Chart Attractive
- Healthy Diet Plan | Healthy Food Ideas | Healthy Diet | Balanced ...
- Healthy Diet Plan | Food Pictures | Healthy Diet | Balance Diet ...
- Healthy Diet Plan | Healthy Diet | Healthy Food Ideas | Drawing Of ...
- Healthy Diet Plan | Healthy Foods | Healthy Diet | Attractive Images ...
- Healthy Food Recipes | Holiday Recipes | Chart Of Balance Diat ...
- Healthy Diet Plan | Healthy Diet | Healthy Food Ideas | Idea For Diet ...
- Balance Diet Chart Images For Project