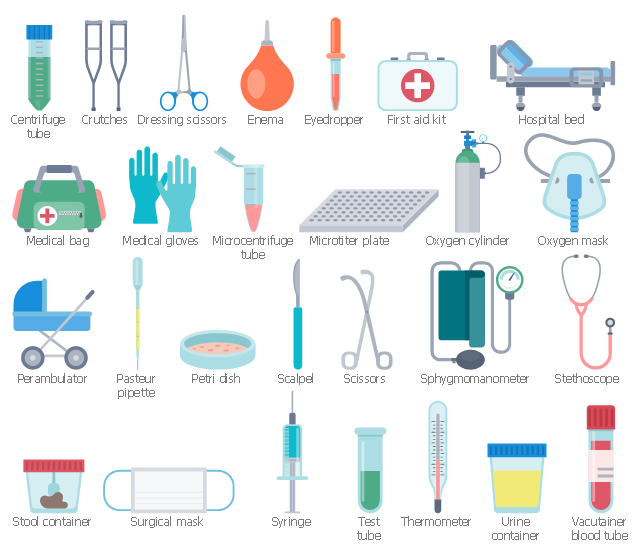
The vector stencils library "Healthcare tools" contains 27 medical instrument and device icons.
Use it to design your healthcare workflow diagrams, flowcharts and infographics with ConceptDraw PRO software.
"A medical device is any apparatus, appliance, software, material, or other article - whether used alone or in combination, including the software intended by its manufacturer to be used specifically for diagnostic and/ or therapeutic purposes and necessary for its proper application - intended by the manufacturer to be used for human beings for the purpose of:
* Diagnosis, prevention, monitoring, treatment, or alleviation of disease;
* Diagnosis, monitoring, treatment, alleviation, or compensation for an injury or handicap;
* Investigation, replacement, or modification of the anatomy or of a physiological process;
* Control of conception; and which does not achieve its principal intended action in or on the human body by pharmacological, immunological, or metabolic means, but which may be assisted in its function by such means." [Medical device. Wikipedia]
The medical instrument icon set example "Design elements - Healthcare tools" is included in Healthcare Workflow Diagrams solution from Business Processes area of ConceptDraw Solution Park.
Workflow shapes
Relationships Analysis

 Healthcare Management Workflow Diagrams
Healthcare Management Workflow Diagrams solution contains large set of colorful samples and libraries with predesigned vector pictograms and symbols of health, healthcare equipment, medical instruments, pharmaceutical tools, transport, medication, departments of healthcare organizations, the medical icons of people and human anatomy, as well as the predesigned flowchart objects, connectors and arrows, which make it the best for designing clear and comprehensive Mediсal Workflow Diagrams and Block Diagrams, Healthcare Management Flowcharts and Infographics, Healthcare Workflow Diagram, for depicting the healthcare workflow and clinical workflows in healthcare, for making the workflow analysis healthcare and healthcare workflow management.
 Health Package
Health Package is a set of multifaceted solutions intended for visualization and illustration in a field of medicine and health, for drawing colorful, interesting and precise illustrations and infographics that will be used successfully in medical documents, articles, special magazines, posters, billboards, websites, presentations, collages. Having these solutions available, it will not be difficult to illustrate the medical editions, to convey the information in a full and interesting form, to teach students with use effective visual methods, to describe the medical facts, to tell about innovations in a field of medicine, health and correct nutrition, to explain the causes and consequences of different diseases, as well as the measures of their prevention and treatment.
CORRECTIVE ACTIONS PLANNING. Risk Diagram (PDPC)
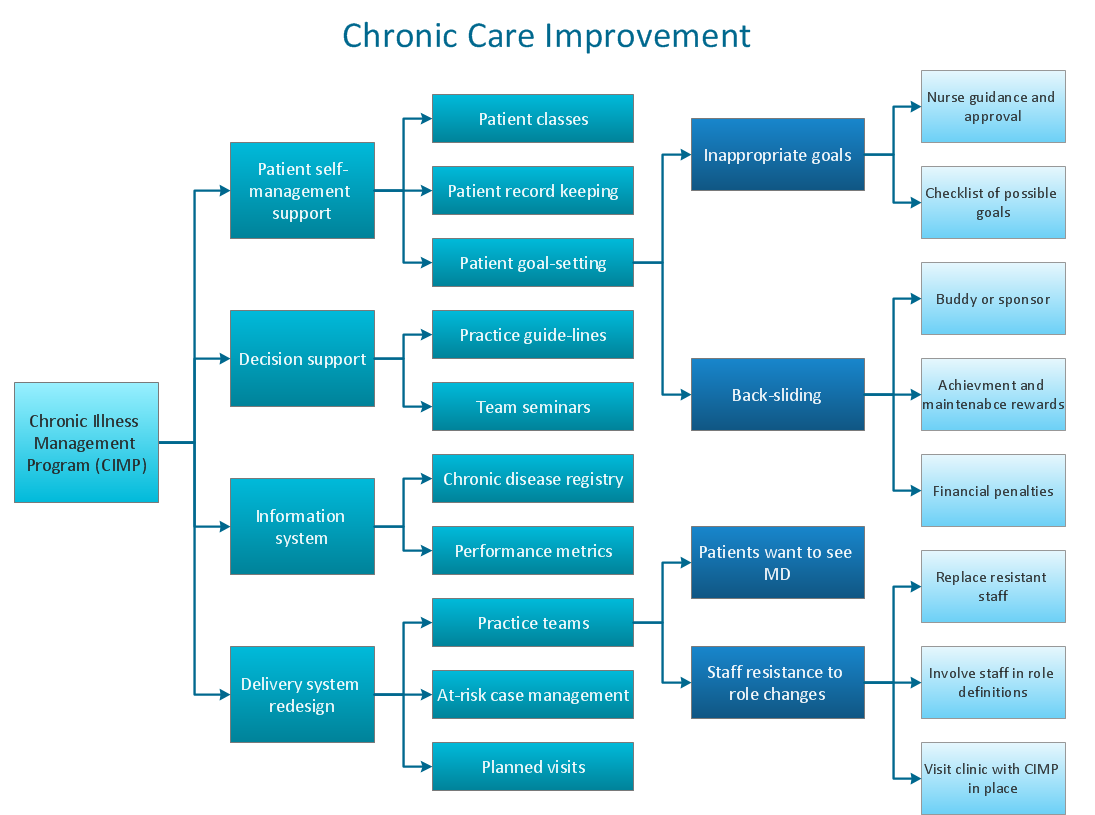
 Seven Management and Planning Tools
Seven Management and Planning Tools solution extends ConceptDraw PRO and ConceptDraw MINDMAP with features, templates, samples and libraries of vector stencils for drawing management mind maps and diagrams.
Presentations in Educational Process

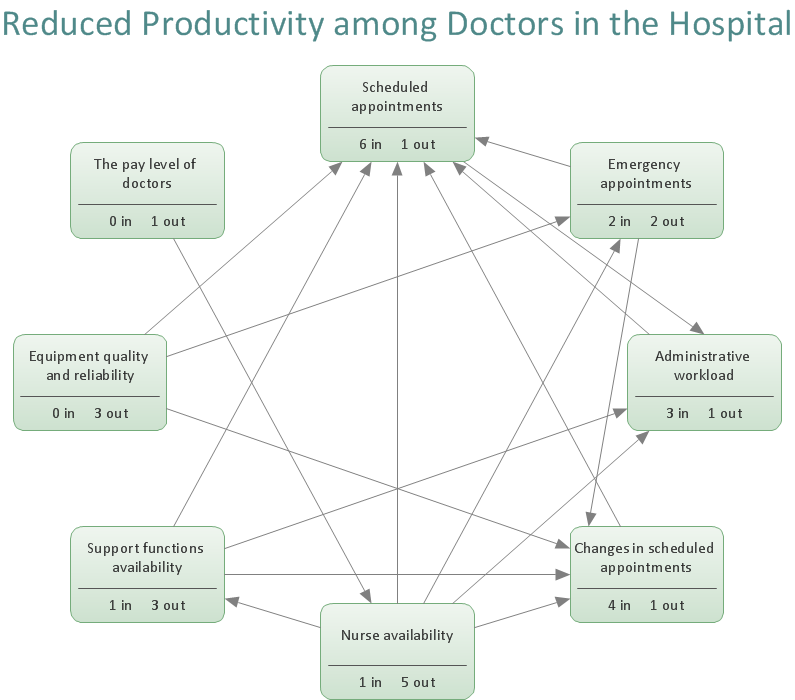
"Interrelationship Digraph (ID).
This tool displays all the interrelated cause-and-effect relationships and factors involved in a complex problem and describes desired outcomes. The process of creating an interrelationship digraph helps a group analyze the natural links between different aspects of a complex situation." [Seven Management and Planning Tools. Wikipedia]
"Causality (also referred to as causation) is the relation between an event (the cause) and a second event (the effect), where the second event is understood as a consequence of the first.
In common usage, causality is also the relation between a set of factors (causes) and a phenomenon (the effect). Anything that affects an effect is a factor of that effect. A direct factor is a factor that affects an effect directly, that is, without any intervening factors. (Intervening factors are sometimes called "intermediate factors".) The connection between a cause(s) and an effect in this way can also be referred to as a causal nexus.
Though the causes and effects are typically related to changes or events, candidates include objects, processes, properties, variables, facts, and states of affairs; characterizing the causal relation can be the subject of much debate." [Causality. Wikipedia]
The relations diagram example "Health care" was created using the ConceptDraw PRO diagramming and vector drawing software extended with the solution "Seven Management and Planning Tools" from the Management area of ConceptDraw Solution Park.
Relations diagram

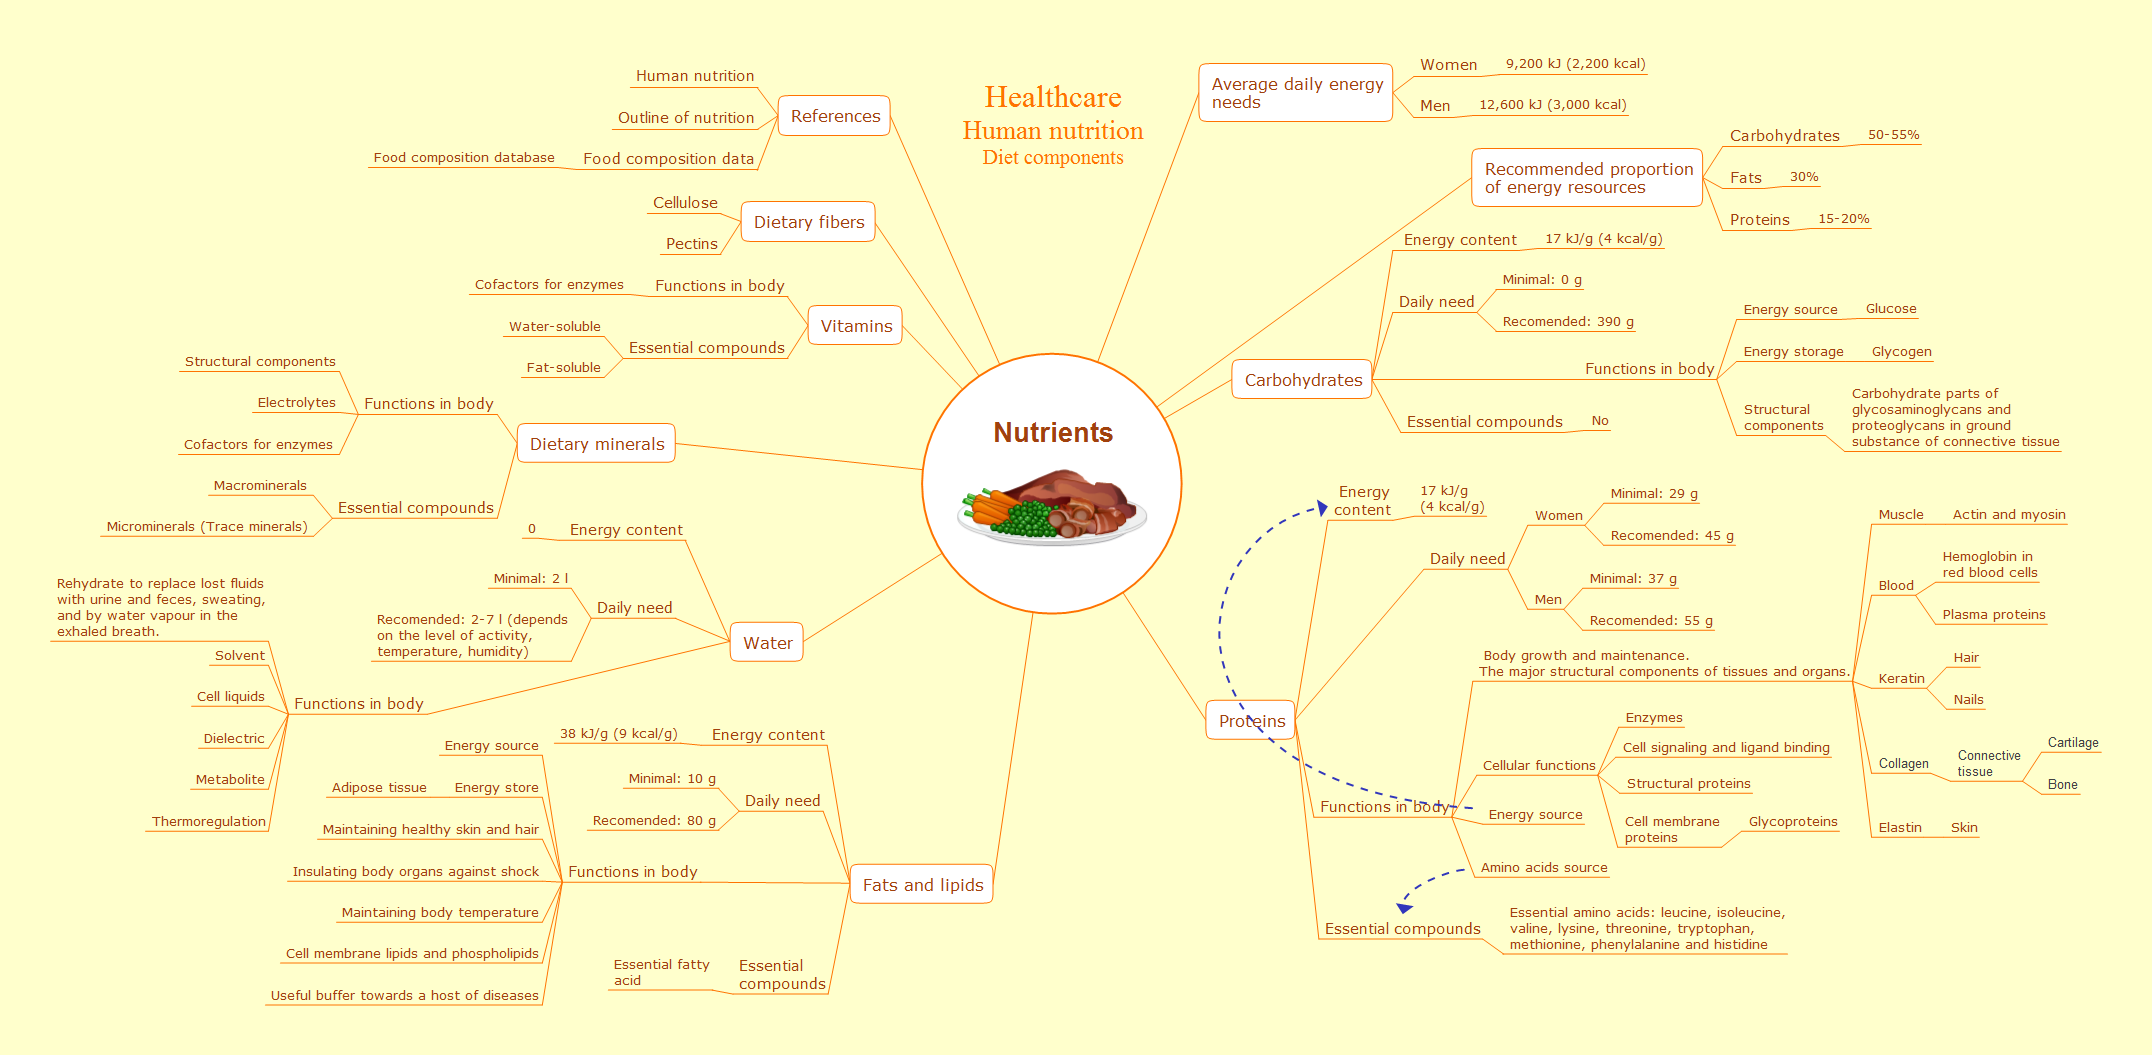
 Medical Illustrations
Medical Illustrations solution including the set of professionally developed examples and samples dedicated to medicine, large variety of ready-to-use vector objects and icons of diagnostic equipment, treatment equipment, medical instruments, tools and devices, medical professionals and health workers of different medical specialties, medical procedures and patients, medical pictograms and medical symbols, among which are the famous red cross symbol, heartbeat symbol, doctor symbol, and many others, is a perfect help in questions of medical illustration and medical imaging, creation professional-looking, colorful and attractive Medical illustrations, Medical diagrams and infographics, slides for presentations in a field of medicine and health care, depicting the medical facts, the information about varied diseases and ways of medical diagnosis, methods of prevention and treatment diseases.
HelpDesk
How to Design Health Science Infographics
- Prioritization matrix - Health care problems | Seven Management ...
- Seven Management and Planning Tools | Healthcare Risk ...
- Prioritization matrix - Health care problems | Seven Management ...
- Conceptdraw.com: Mind Map Software, Drawing Tools | Project ...
- Seven Basic Tools of Quality | Primary Health Centre Bubble Diagram
- Prioritization matrix - Health care problems | Relations diagram ...
- Relations diagram - Template | Relations diagram - Health care ...
- Swot Analysis In Healthcare Ppt
- Healthcare Management Workflow Diagrams | Small business ...
- Healthcare Management Workflow Diagrams | Quality Mind Map ...