 Line Graphs
How to draw a Line Graph with ease? The Line Graphs solution extends the capabilities of ConceptDraw PRO v10 with professionally designed templates, samples, and a library of vector stencils for drawing perfect Line Graphs.
 Bar Graphs
The Bar Graphs solution enhances ConceptDraw PRO v10 functionality with templates, numerous professional-looking samples, and a library of vector stencils for drawing different types of Bar Graphs, such as Simple Bar Graph, Double Bar Graph, Divided Bar Graph, Horizontal Bar Graph, Vertical Bar Graph, and Column Bar Chart.
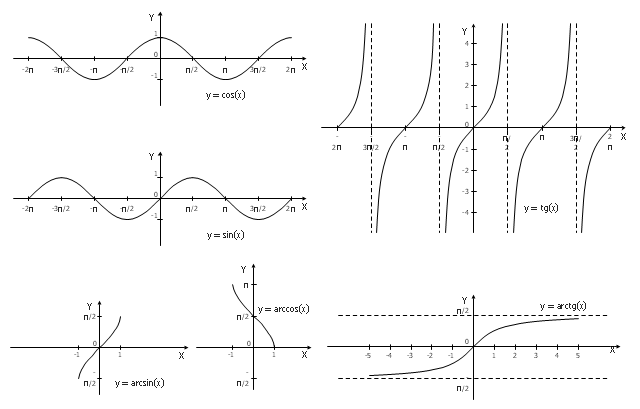
The vector stencils library "Trigonometric functions" contains 8 shapes of trigonometrical and inverse trigonometrical functions graphs.
"In mathematics, the trigonometric functions (also called the circular functions) are functions of an angle. They relate the angles of a triangle to the lengths of its sides. Trigonometric functions are important in the study of triangles and modeling periodic phenomena, among many other applications.
The most familiar trigonometric functions are the sine, cosine, and tangent. In the context of the standard unit circle with radius 1 unit, where a triangle is formed by a ray originating at the origin and making some angle with the x-axis, the sine of the angle gives the length of the y-component (the opposite to the angle or the rise) of the triangle, the cosine gives the length of the x-component (the adjacent of the angle or the run), and the tangent function gives the slope (y-component divided by the x-component). More precise definitions are detailed below. Trigonometric functions are commonly defined as ratios of two sides of a right triangle containing the angle, and can equivalently be defined as the lengths of various line segments from a unit circle. More modern definitions express them as infinite series or as solutions of certain differential equations, allowing their extension to arbitrary positive and negative values and even to complex numbers." [Trigonometric functions. Wikipedia]
The shapes example "Design elements - Trigonometric functions" was created using the ConceptDraw PRO diagramming and vector drawing software extended with the Mathematics solution from the Science and Education area of ConceptDraw Solution Park.
Trigonometrical and inverse trigonometrical functions - Graphs
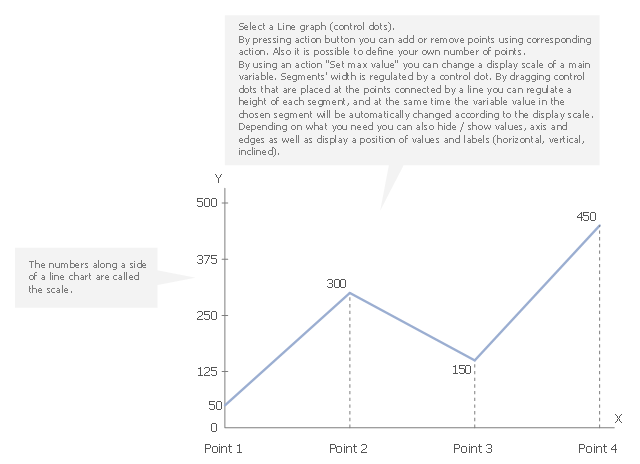
This line graph templates shows the number of tourists visiting the resort town for six months. Use it to design your time series line charts in ConceptDraw PRO diagramming and vector drawing software.
"A time series is a sequence of data points, measured typically at successive points in time spaced at uniform time intervals. ... Time series are very frequently plotted via line charts. Time series are used in statistics, signal processing, pattern recognition, econometrics, mathematical finance, weather forecasting, earthquake prediction, electroencephalography, control engineering, astronomy, and communications engineering. Time series analysis comprises methods for analyzing time series data in order to extract meaningful statistics and other characteristics of the data. Time series forecasting is the use of a model to predict future values based on previously observed values. While regression analysis is often employed in such a way as to test theories that the current values of one or more independent time series affect the current value of another time series, this type of analysis of time series is not called "time series analysis", which focuses on comparing values of time series at different points in time. Time series data have a natural temporal ordering." [Time series. Wikipedia]
The chart template "Line graph" is included in the Basic Line Graphs solution from the Graphs and Charts area of ConceptDraw Solution Park.
Chart template
- Holiday | Pie Charts | Line Graphs | New Year And Christmas Card ...
- Bar Graphs Png
- Food - Vector stencils library | Picture graphs - Vector stencils library ...
- 3d Bar Graph Png
- Picture Chart Of Png Foods
- Chart Templates | Professions - Vector stencils library | Ranks US ...
- USA Maps | UK Map | Australia Map | Architectural North Arrow Png
- Bar Graph Png
- Pie Charts | DroidDia prime | Pie Chart Software | Circle Graph Png ...
- 3D Column chart - Iran internet users per 100 person | Column Chart ...
- Pictures of Graphs | Pictures of Vegetables | Pictures of Food | Pict ...
- Watercraft - Vector stencils library | Watercraft - Design Elements ...
- Investment Png
- Person Infographic Icon Png
- Bar Chart Software | Column Chart Software | Chart Maker for ...
- GPRS network diagram | Picture graphs - Vector stencils library ...
- Design elements - Tab Bar Icons | iPhone User Interface | Graphical ...
- 3d Circle Png
- Bar Chart Icon Png
- Percentage Chart Png