 Health Food
The Health Food solution contains the set of professionally designed samples and large collection of vector graphic libraries of healthy foods symbols of fruits, vegetables, herbs, nuts, beans, seafood, meat, dairy foods, drinks, which give powerful possi
 Pie Charts
Pie Charts are extensively used in statistics and business for explaining data and work results, in mass media for comparison (i.e. to visualize the percentage for the parts of one total), and in many other fields. The Pie Charts solution for ConceptDraw PRO v10 offers powerful drawing tools, varied templates, samples, and a library of vector stencils for simple construction and design of Pie Charts, Donut Chart, and Pie Graph Worksheets.
HelpDesk
How to Design a Food-related Infographics Using ConceptDraw PRO

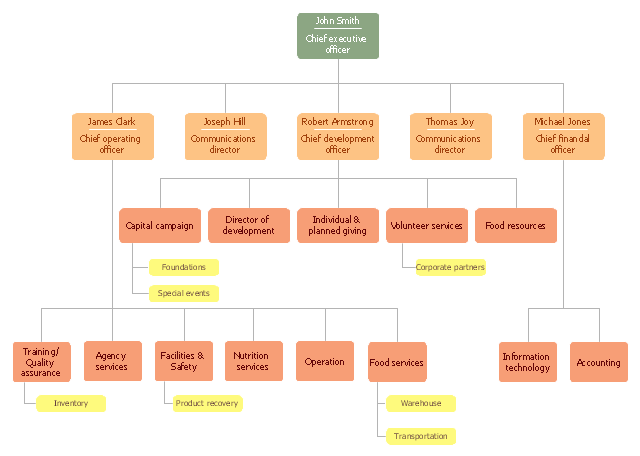
"A food bank or foodbank is a non-profit, charitable organization that distributes food to those who have difficulty purchasing enough food to avoid hunger.
In the United States and Australia, food banks usually operate on the "warehouse" model. They act as food storage and distribution depots for smaller front line agencies; and usually do not themselves give out food directly to the hungry. After the food is collected, sorted, and reviewed for quality, these food banks distribute it to non-profit community or government agencies, including food pantries, food closets, soup kitchens, homeless shelters, orphanages, and schools.
Outside North America and Australia, the "front line" model is often found. Such food banks give out most or all of their food directly to the end users. For both models, the largest sources of food include for-profit growers, manufacturers, distributors and retailers who in the normal course of business have excess food that they cannot sell. Some foodbanks receive a substantial proportion of their food from individual donors, including their volunteer workers. There is considerable overlap with food salvage, food rescue and gleaning, although not with freeganism or dumpster-diving." [Food bank. Wikipedia]
The organization chart example "Foodbank" was created using the ConceptDraw PRO diagramming and vector drawing software extended with the Organizational Charts solution from the Management area of ConceptDraw Solution Park.
Organizational chart
HelpDesk
How to Create Infographics that Help People Eat Healthy

Create Sophisticated Professional Diagrams - Simply

 Area Charts
Area Charts are used to display the cumulative totals over time using numbers or percentages; or to show trends over time among related attributes. The Area Chart is effective when comparing two or more quantities. Each series of data is typically represented with a different color, the use of color transparency in an object’s transparency shows overlapped areas and smaller areas hidden behind larger areas.
 Sales Flowcharts
The Sales Flowcharts solution lets you create and display sales process maps, sales process workflows, sales steps, the sales process, and anything else involving sales process management.
 Organizational Charts
Organizational Charts solution extends ConceptDraw PRO software with samples, templates and library of vector stencils for drawing the org charts.
This flow chart sample was drawn on the base on the illustration of the article "Climate change impact on China food security in 2050" from the website of Chinese Academy of Agricultural Sciences .
[caas.cn/ en/ newsroom/ research_ update/ 67347.shtml]
"Food security is a condition related to the ongoing availability of food. ...
According to the Food and Agriculture Organization (FAO), food security "exists when all people, at all times, have physical and economic access to sufficient, safe and nutritious food to meet their dietary needs and food preferences for an active and healthy life". ...
Extreme events, such as droughts and floods, are forecast to increase as climate change takes hold. Ranging from overnight floods to gradually worsening droughts, these will have a range of impacts on the agricultural sector. ...
According to the Climate & Development Knowledge Network report Managing Climate Extremes and Disasters in the Agriculture Sectors: Lessons from the IPCC SREX Report, the impacts will include changing productivity and livelihood patterns, economic losses, and impacts on infrastructure, markets and food security. Food security in future will be linked to our ability to adapt agricultural systems to extreme events." [Food security. Wikipedia]
The flowchart example "Food security assessment" was created using the ConceptDraw PRO diagramming and vector drawing software extended with the Flowcharts solution from the area "What is a Diagram" of ConceptDraw Solution Park.
Flowchart

- Food - Vector stencils library | Histogram Chart | Make a Histogram ...
- Food Art | Chore charts with ConceptDraw PRO | Cooking Recipes ...
- Management - Design Elements | Pie Charts | Pictures of ...
- Juice bar | Pie Charts | F&B | Juices Infographic Png
- Process Flowchart | Design elements - Food | Chore charts with ...
- Cafe Food Png
- Marketing Diagrams | Computer and Networks Area | Food Court ...
- Healthy Foods | Quick Recipes | Healthy Food Ideas | Png Images ...
- Food Png Image
- DroidDia prime | Health Food | ConceptDraw Solution Park | Black ...
- Food Security Png Vector
- iPhone User Interface | Health Food | USA Maps | News Title Bar Png
- People | Health Food | iPhone User Interface | People News Png
- Food Court | Sales Flowcharts | Business feedback loop | Shopping ...
- Png Pictogram Of Food Processing Plant
- Pictures of Vegetables | Food Court | How to Draw Pictorial Chart ...
- Kitchen and dining room - Vector stencils library | Food Court ...
- Pictures of Graphs | Pictures of Vegetables | Pictures of Food | Pict ...
- Android User Interface | Restaurant plan | Pie Chart Software ...
- Healthy Diet Plan | Healthy Diet | Food Pictures | Image Of Balance ...