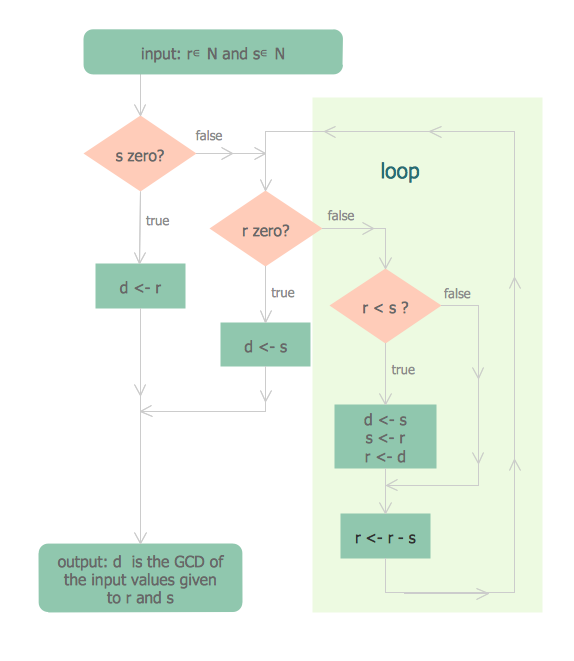
"In mathematics, the Euclidean algorithm, or Euclid's algorithm, is a method for computing the greatest common divisor (GCD) of two (usually positive) integers, also known as the greatest common factor (GCF) or highest common factor (HCF). ...
The GCD of two positive integers is the largest integer that divides both of them without leaving a remainder (the GCD of two integers in general is defined in a more subtle way).
In its simplest form, Euclid's algorithm starts with a pair of positive integers, and forms a new pair that consists of the smaller number and the difference between the larger and smaller numbers. The process repeats until the numbers in the pair are equal. That number then is the greatest common divisor of the original pair of integers.
The main principle is that the GCD does not change if the smaller number is subtracted from the larger number. ... Since the larger of the two numbers is reduced, repeating this process gives successively smaller numbers, so this repetition will necessarily stop sooner or later - when the numbers are equal (if the process is attempted once more, one of the numbers will become 0)." [Euclidean algorithm. Wikipedia]
The flowchart example "Euclidean algorithm" was created using the ConceptDraw PRO diagramming and vector drawing software extended with the Mathematics solution from the Science and Education area of ConceptDraw Solution Park.
Euclid's algorithm flow chart

Ordering Process Flowchart. Flowchart Examples
Example Basic Flowchart. Flowchart Examples
Credit Card Order Process Flowchart. Flowchart Examples

Swim Lane Diagrams

Flowchart Symbols Accounting. Activity-based costing (ABC) flowchart

How To Use Collaboration Tool in Project Management


- Euclidean algorithm - Flowchart | Flowchart For Finding Gcd Of Two ...
- Euclidean algorithm - Flowchart | Mathematics | Flow Chart For ...
- Visual Basic Program And Flowchart On Gcd Of Two Numbers
- Flowchart Of G C D Of Two Positive Integers
- Flow Chart For Gcd Program
- Flow Chart Of Computer For Hcf And Gcd Of Two Number
- Find The Gcd With Flowchart And Algorithm
- Euclidean algorithm - Flowchart | Solving quadratic equation ...
- Draw The Flowchart To Find Factors Between Two Numbers