 Flowcharts
The Flowcharts Solution for ConceptDraw PRO v10 is a comprehensive set of examples and samples in several different color themes for professionals that need to graphically represent a process. Solution value is added by basic flow chart template and shapes' library of Flowchart notation. ConceptDraw PRO flow chart creator lets one depict a processes of any complexity and length, as well design of the flowchart either vertically or horizontally.
 Sales Flowcharts
The Sales Flowcharts solution lets you create and display sales process maps, sales process workflows, sales steps, the sales process, and anything else involving sales process management.
HelpDesk
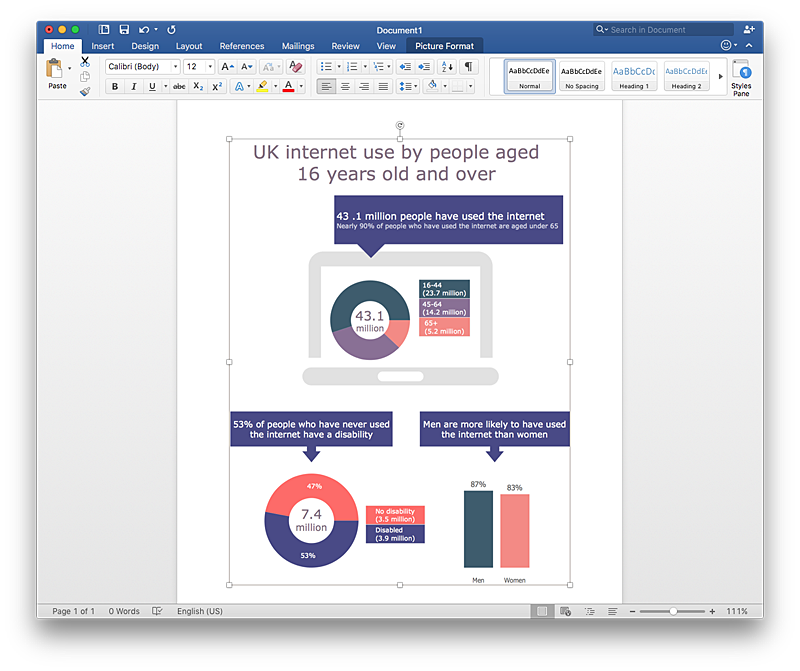
How to Add Data-driven Infographics to a MS Word Document Using ConceptDraw PRO
Infographics ae usually used as an effective way of showing a certain portion of information . There are a wide of range of subjects that can be represented in a such way. One of the most simple usage for the infographics, in business diagrams. Sales staff can use it as an effective method of sharing the sales results with the entire team and stakeholders. ConceptDraw Data-driven Infographics solution gives all the tools one need to present a certain type of data. ConceptDraw PRO allows you to easily create data-driven infographics and then insert them into a MS Word document.
 HR Flowcharts
Human resource management diagrams show recruitment models, the hiring process and human resource development of human resources.
HelpDesk
How to Create Education Infographics
Education Infographics is used to display a lot of education-related information in a single, visually-appealing graphic. Infographics, created for education purposes can contain different illustrations, detailed charts, and data. ConceptDraw PRO can be used as a tool for creating education infographics. It allows you to draw infographics quickly and easily using the special templates and vector stencils libraries. Infographics can be used to quickly communicate a message, to simplify the presentation of large amounts of data, to see data patterns and relationships, and to monitor changes in variables over time. It can contain bar graphs, pie charts, histograms, line charts, e.t.c.HelpDesk
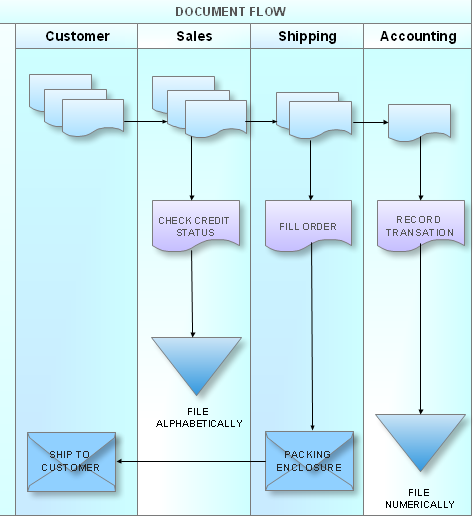
How to Create a Cross - Functional Flowchart Using ConceptDraw PRO
Cross-functional flowcharts are used to visualize cross-functional processes. Cross-functional process is a process that involves multiple divisions, each of which makes its part of the entire company workflow. For example: product development, lead management , client orders processing – and other critical processes. All of them are important both for business and customers, but the workflow and responsibilities distribution within these processes are divided between multiple departments and services. Cross-functional processes cannot be depicted with simple workflow diagrams, because of the specific interactions between company departments. ConceptDraw PRO has released the specialized solution to create cross-functional diagrams. Cross Functional Flowcharts solution includes a special set of templates and libraries to depict the cross-functional processes.
 Audit Flowcharts
Audit flowcharts solution extends ConceptDraw PRO software with templates, samples and library of vector stencils for drawing the audit and fiscal flow charts.
 ConceptDraw Solution Park
ConceptDraw Solution Park collects graphic extensions, examples and learning materials
 Accounting Flowcharts
Accounting Flowcharts solution extends ConceptDraw PRO software with templates, samples and library of vector stencils for drawing the accounting flow charts.
 Cross-Functional Flowcharts
Cross-functional flowcharts are powerful and useful tool for visualizing and analyzing complex business processes which requires involvement of multiple people, teams or even departments. They let clearly represent a sequence of the process steps, the order of operations, relationships between processes and responsible functional units (such as departments or positions).
HelpDesk
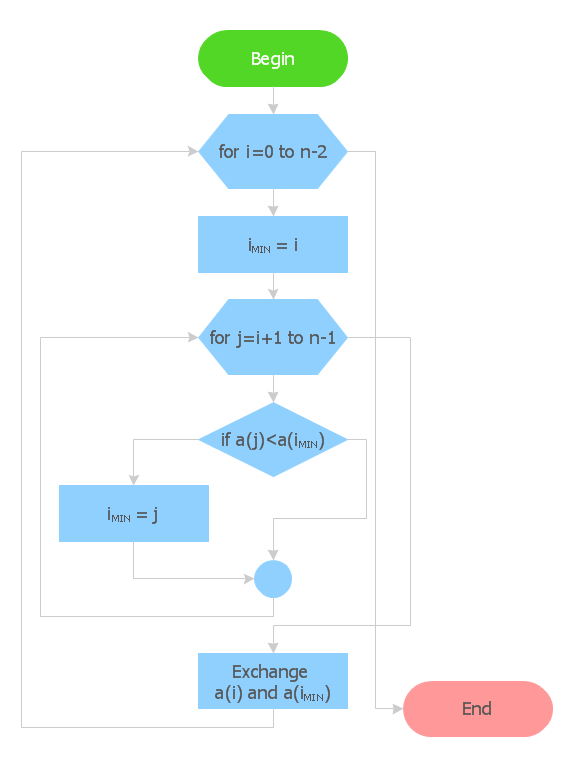
How to Create Flowchart Using Standard Flowchart Symbols
Flowcharts are used to display an algorithm for consistent execution of certain steps. Flowchart is probably the easiest way to make a graphical representation of any process. Flowcharts use the set of standard geometric symbols and arrows to define relationships. ConceptDraw PRO allows you to create professional flowchart quickly and easily. The ability to create flowcharts is contained in the Flowcharts solution. The solution provides a set of special tools for creating flowcharts.HelpDesk
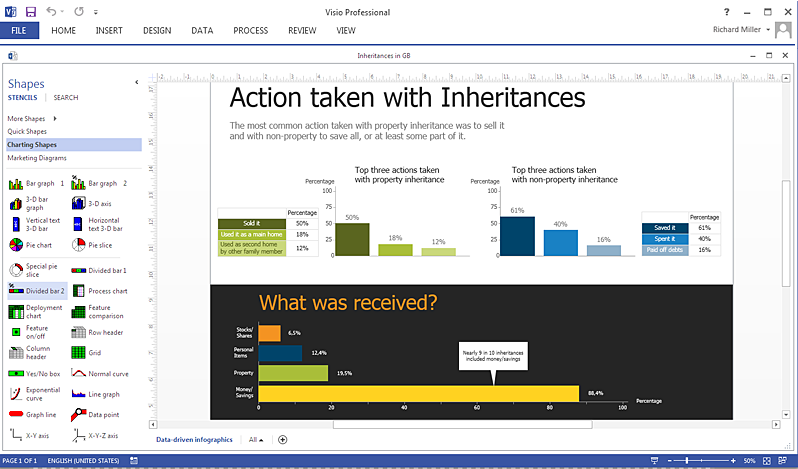
How To Create a MS Visio Data-driven Infographics Using ConceptDraw PRO
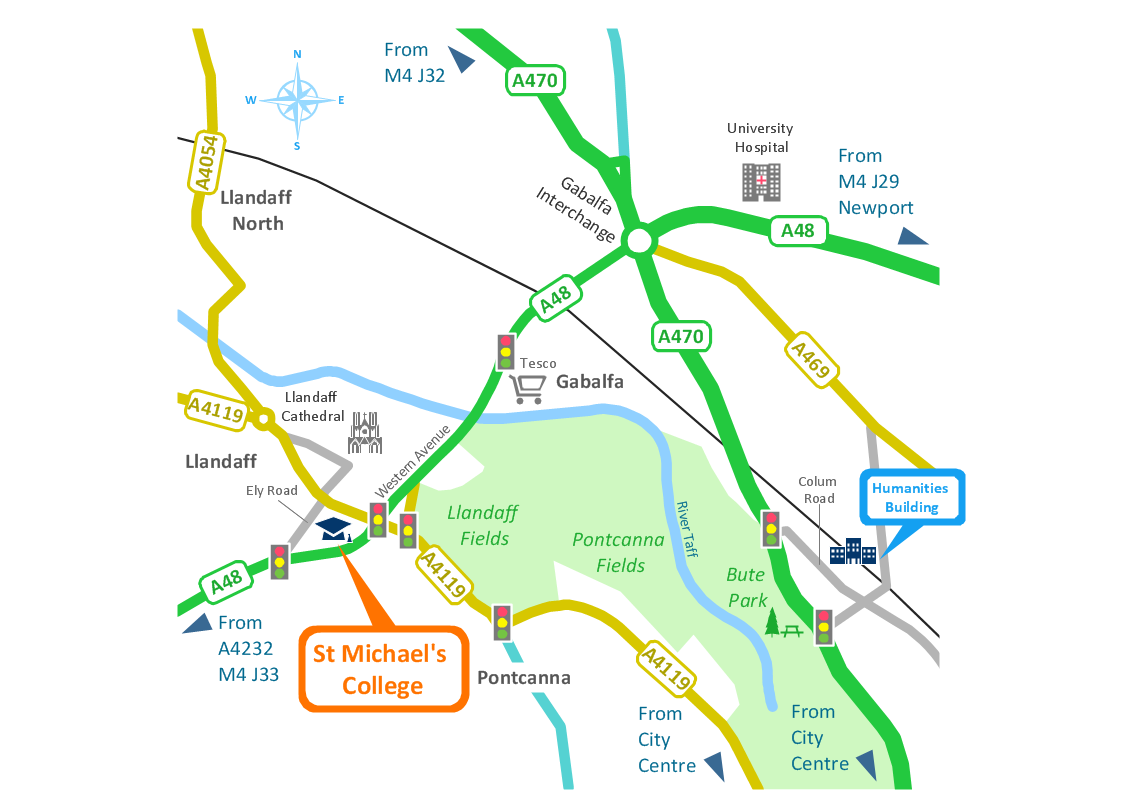
ConceptDraw PRO allows you to easily create data-driven infographics of any complexity and then make a MS Visio file from your diagram in a few simple steps.Spatial infographics Design Elements: Location Map
Infographic Design Elements for visually present various geographically distributed information.How tо Represent Information Graphically
ConceptDraw Infographics is a great visual tool for communicating the large amounts of data and graphic visualization and representations of data and information.- Spatial infographics Design Elements: Location Map | Process ...
- Flow chart Example. Warehouse Flowchart | Spatial infographics ...
- Import process - Flowchart | Marketing Infographics | Flow Chart Of ...
- Marketing Plan Infographic | Marketing Analysis Diagram | Flowchart ...
- Flowchart Maker | Pyramid Chart Maker | Map Infographic Maker ...
- Flowchart Software | How to Create Education Infographics | Basic ...
- Flowcharts | How to Design a Food-related Infographics Using ...
- How to Create Education Infographics | Basic Flowchart Symbols ...
- How to Create Marketing Infographics | Marketing | Flowchart ...
- Flowchart Software | Education Infographics | How to Purchase ...
- Sample Pictorial Chart . Sample Infographics | Business process ...
- Flow chart Example. Warehouse Flowchart | Transportation ...
- Online store social media response flowchart | Social Media ...
- Sales Process Flowchart . Flowchart Examples | Spatial Infographics ...
- Subway infographic design elements - software tools | Process ...
- Process Flowchart | How to draw Metro Map style infographics ...
- Process Flowchart | Cross-Functional Flowchart | Infographic ...
- Sample Pictorial Chart. Sample Infographics | Basic Flowchart ...
- Basic Diagramming | Winter Sports. Olympic Games Infographics ...
- Flow chart Example. Warehouse Flowchart | Infographic Generator ...
