Cross-Functional Flowchart
Use of Cross-Functional Flowchart is a clear way of showing each team member’s responsibilities and how processes get shared or transferred between different responsible people, teams and departments. Use the best flowchart maker ConceptDraw PRO with a range of standardized cross-functional flowchart symbols to create the Cross-Functional Flowcharts simply and to visualize the relationship between a business process and the functional units responsible for that process. To draw the most quickly Cross-Functional Flowcharts, Cross Functional Process Maps, or Cross Functional Process Flow Diagrams, start with a Cross-functional flowchart samples and templates from ConceptDraw Solution Park. The ConceptDraw Arrows10 and RapidDraw technologies will be also useful for you in drawing. ConceptDraw PRO supports designing both types - horizontal and vertical Cross-functional flowcharts. A vertical layout makes the accents mainly on the functional units while a horizontal layout - on the process. If you need a Visio alternative in Mac OS X, try ConceptDraw PRO. Its interface is very intuitive and it’s actually much easier to use than Visio, yet somehow it’s just as powerful if not more so. ConceptDraw PRO performs professional quality work and seamless Visio interaction.
Definition TQM Diagram
The Total Quality Management Diagram solution helps your organization visualize business and industrial processes. Create Total Quality Management diagrams for business process with ConceptDraw software.Network Topologies
Network topology is a topological structure of computer network, which can be physical or logical. The physical topology depicts location of different computer network elements such as computers, cables and other devices. The logical topology visually displays network dataflows from one device to another. Sometimes network logical and physical topologies can be the same. ConceptDraw PRO diagramming and vector drawing software is powerful for drawing network maps and network topologies diagrams of any kinds and complexity thanks to the Computer Network Diagrams solution from the Computer and Networks area. ConceptDraw STORE proposes collection of network icons libraries and a lot of Network Topology Diagram examples, samples and templates which were created at ConceptDraw PRO software specially for Computer Network Diagrams solution. There are six basic types of the network topologies: Bus, Star, Ring, Mesh, Tree, Fully Connected. You can fast and easy design professional-looking diagram for each of them using the ConceptDraw PRO tools. There are plenty of web Visio-like diagramming software available. Web based diagrams software can be powerful, but sometimes it is essential to have desktop software. One of the most advanced diagrams tools like Visio for Mac OS is ConceptDraw PRO app.
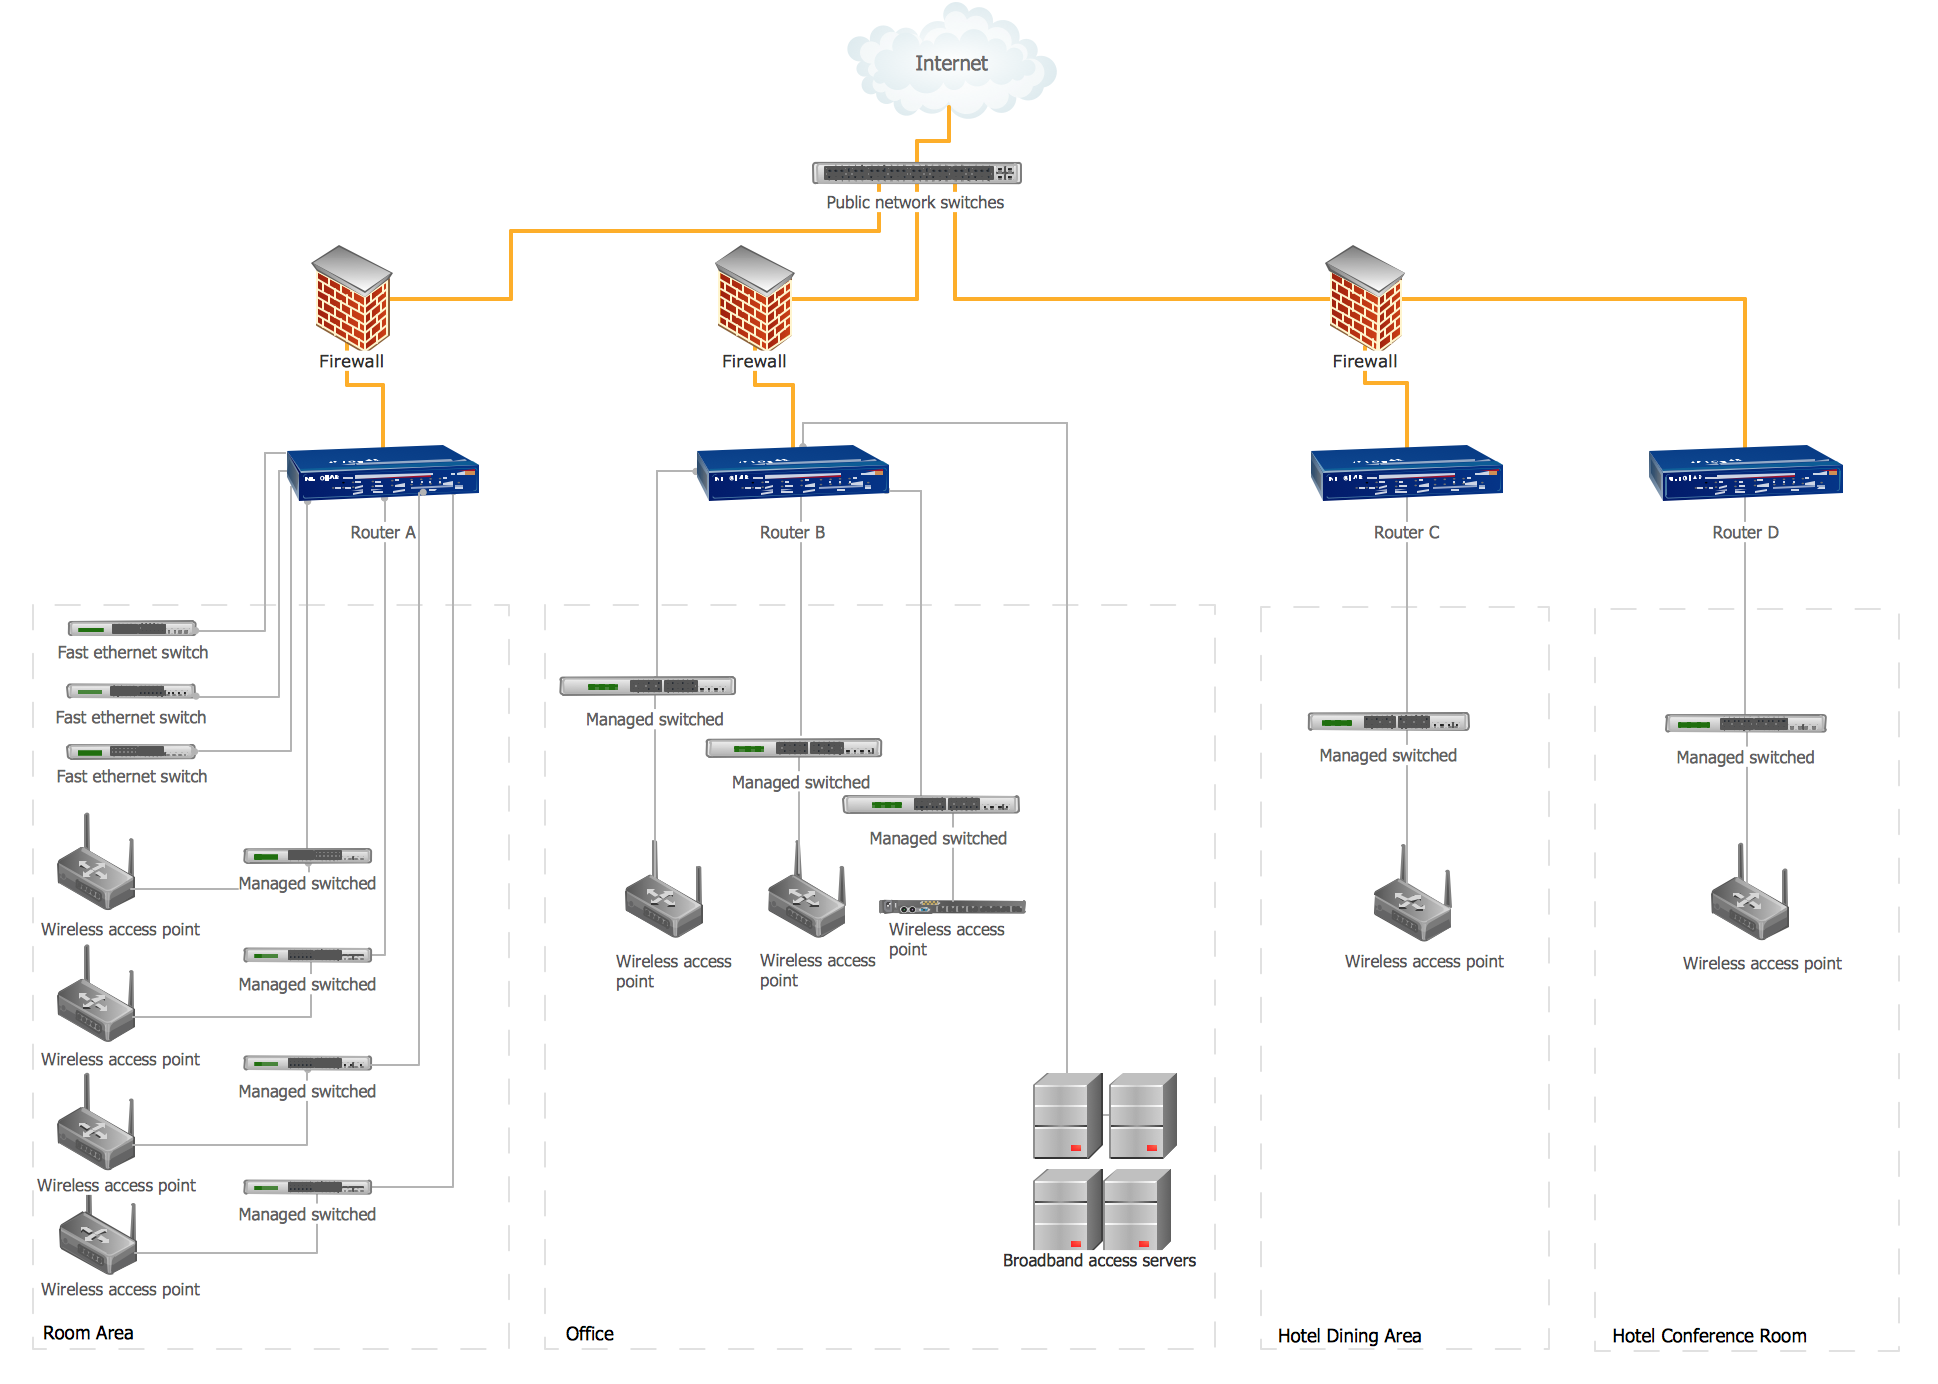
Hotel Network Topology Diagram
Network topology is a layout of various elements of computer network, such as nodes, links, routers, etc. It is a network topological structure which can be depicted logically or physically. Physical topology shows the physical location of network's components and cable connections between network nodes. Logical topology describes the data flows, the circulation of signals in physical topology. The physical and logical topologies for two networks can be identical, while their physical interconnections, the distances between nodes, transmission rates, and/or signal types may be differ. ConceptDraw PRO with Computer and Networks solution from Computer and Networks area of ConceptDraw Solution Park lets you design physical and logical network topology diagrams for wireless and wired computer communication networks located in various premises, including the hotels. You can easy design Hotel Network Topology Diagram, diagrams depicted LANs and WLANs, and also any of eight basic topologies (Point-to-point, Star, Bus, Mesh, Ring, Tree, Hybrid, Daisy chain).
 Fishbone Diagram
Fishbone Diagrams solution extends ConceptDraw PRO software with templates, samples and library of vector stencils for drawing the Ishikawa diagrams for cause and effect analysis.
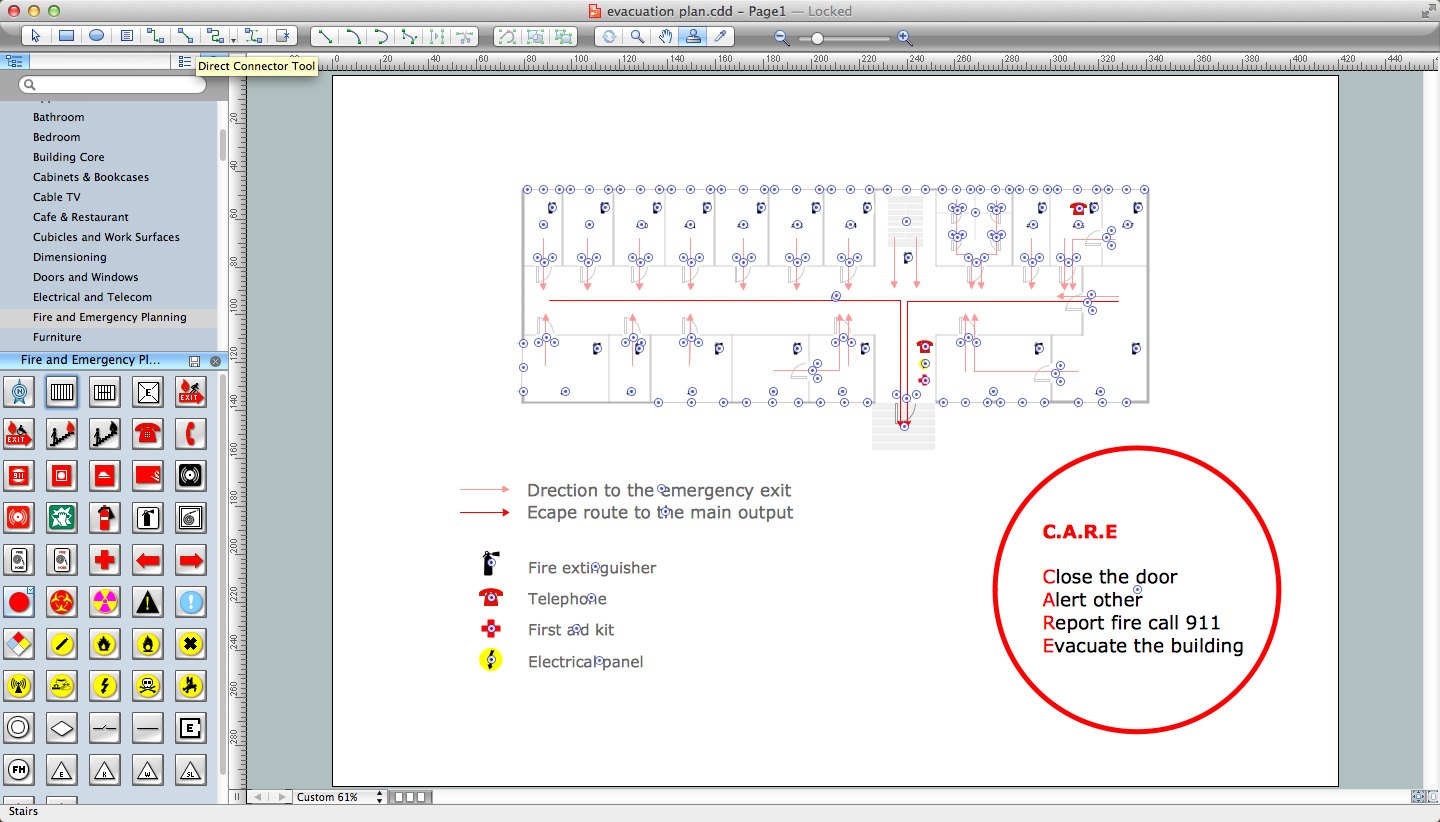
Emergency Plan
The Fire Emergency Plan illustrates the scheme of the building and location of the main and fire exits for a safe evacuation, and clearly defines directions to them on the plan. Fire Emergency Plans are constructed on the case of unexpected or emergency situations, fires, hazardous leaks, natural disasters, and other sudden events. They must to be obligatorily on the plain sight at every building and on each floor, at living houses and apartments, schools and universities, medical centers, clinics and hospitals, office buildings, banks, cafes, restaurants, and also at all other public buildings and institutions. The Evacuation plans and Emergency Plans preliminary designed in ConceptDraw PRO software help employees and family members when some emergency events happen and let avoid the accidents and sad consequences, prevent injuries and fatalities, allow reduce damages and speed the work resumption. Start drawing emergency blueprint from floor bounds, then add the inner walls and doors, and finally use bright arrows to visually show evacuation directions to fire exits. ConceptDraw is a serious alternative to Visio. It's a desktop based solution aimed at professional designers working in CAD environments. It is also a good option for those who work between Mac and PC because one license is valid for both.
UML Use Case Diagram Example Social Networking Sites Project
UML Diagrams Social Networking Sites Project. This sample was created in ConceptDraw PRO diagramming and vector drawing software using the UML Use Case Diagram library of the Rapid UML Solution from the Software Development area of ConceptDraw Solution Park. This sample shows the Facebook Socio-health system and is used at the projection and creating of the social networking sites.
 Entity-Relationship Diagram (ERD)
Entity-Relationship Diagram (ERD) solution extends ConceptDraw PRO software with templates, samples and libraries of vector stencils from drawing the ER-diagrams by Chen's and crow’s foot notations.
 Area Charts
Area Charts are used to display the cumulative totals over time using numbers or percentages; or to show trends over time among related attributes. The Area Chart is effective when comparing two or more quantities. Each series of data is typically represented with a different color, the use of color transparency in an object’s transparency shows overlapped areas and smaller areas hidden behind larger areas.
 Line Graphs
How to draw a Line Graph with ease? The Line Graphs solution extends the capabilities of ConceptDraw PRO v10 with professionally designed templates, samples, and a library of vector stencils for drawing perfect Line Graphs.
- Dfd For Account Department Of College
- 4 Level pyramid model diagram - Information systems types ...
- Flowchart For A Football System
- Basic Flowchart Symbols and Meaning | Process Flowchart | Flow ...
- Organizational Structure | Basic Flowchart Symbols and Meaning ...
- Basic Flowchart Symbols and Meaning | Flowchart | Process ...
- Flow Chart For A Football Management System
- Cross-Functional Flowchart (Swim Lanes) | Swim Lane Diagrams ...
- Basic Flowchart Symbols and Meaning | Structured Systems ...
- Structured Systems Analysis and Design Method (SSADM) with ...
- Accounting Flowchart Symbols
- Flowchart Maker | Simple Flow Chart | Accounting Flowchart ...
- DFD Library System | Data Flow Diagram Symbols. DFD Library ...
- Accounting Information Systems Flowchart Symbols | Accounting ...
- DFD Library - Design elements | Data Flow Diagram (DFD ...
- Contoh Flowchart | Flowcharts | How to Create a Network Security ...
- DFD Library System | Data Flow Diagrams (DFD) | Management ...
- Basic Flowchart Symbols and Meaning | Campus Area Networks ...
- Process Flowchart | Structured Systems Analysis and Design ...
- 5 Level pyramid model diagram - Information systems types ...


