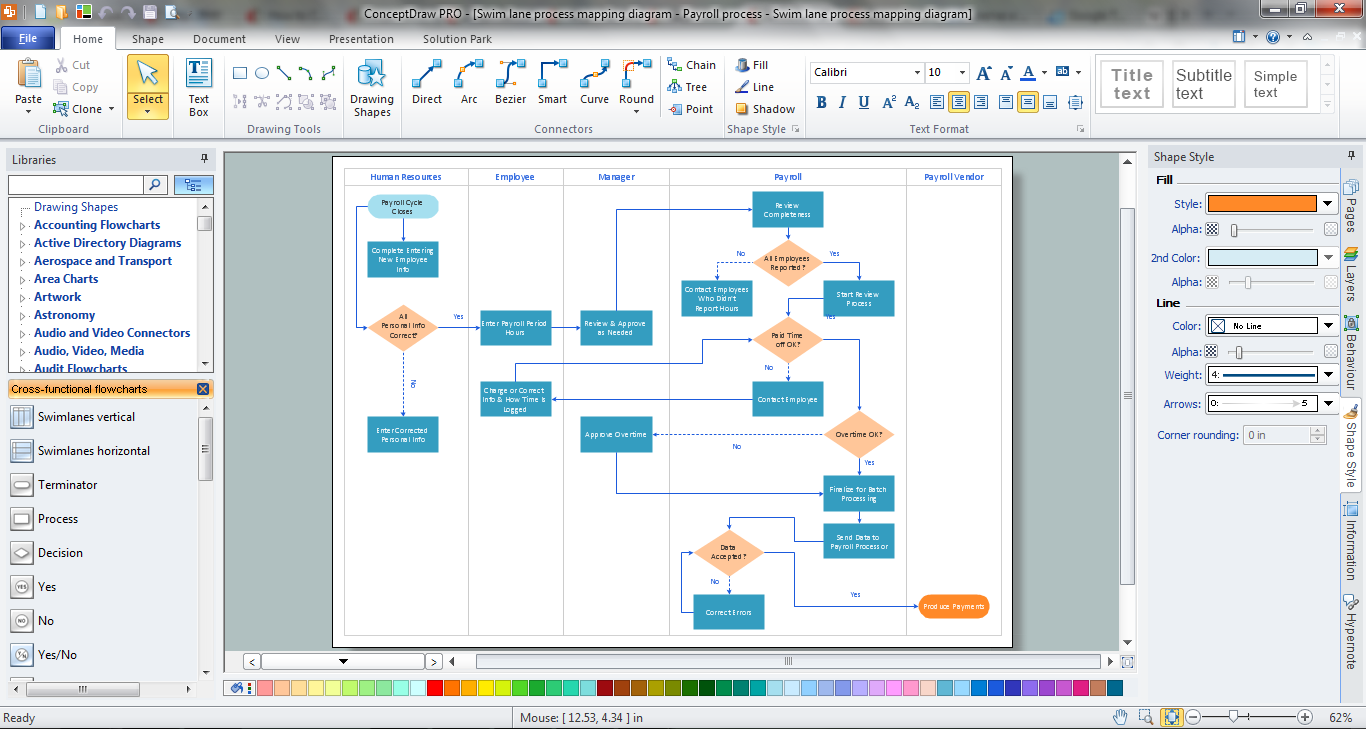
How to Simplify Flow Charting — Cross-functional Flowchart
In ConceptDraw DIAGRAM it really is sp simple to draw even the most complex cross-functional flowcharts. Use the RapidDraw technology and Cross-Functional libraries in ConceptDraw DIAGRAM for the best results.                        
                            
                                
                                Business Process Diagrams                            


                            Business Process Diagrams solution extends the ConceptDraw DIAGRAM BPM software with RapidDraw interface, templates, samples and numerous libraries based on the BPMN 1.2 and BPMN 2.0 standards, which give you the possibility to visualize equally easy simple and complex processes, to design business models, to quickly develop and document in details any business processes on the stages of project’s planning and implementation.                        
                    Business diagrams & Org Charts with ConceptDraw DIAGRAM
The business diagrams are in great demand, they describe the business processes, business tasks and activities which are executed to achieve specific organizational and business goals, increase productivity, reduce costs and errors. They let research and better understand the business processes. ConceptDraw DIAGRAM is a powerful professional cross-platform business graphics and business flowcharting tool which contains hundreds of built-in collections of task-specific vector stencils and templates. They will help you to visualize and structure information, create various Business flowcharts, maps and diagrams with minimal efforts, and add them to your documents and presentations to make them successful. Among them are Data flow diagrams, Organization charts, Business process workflow diagrams, Audit flowcharts, Cause and Effect diagrams, IDEF business process diagrams, Cross-functional flowcharts, PERT charts, Timeline diagrams, Calendars, Marketing diagrams, Pyramids, Target diagrams, Venn diagrams, Comparison charts, Analysis charts, Dashboards, and many more. Being a cross-platform application, ConceptDraw DIAGRAM is very secure, handy, free of bloatware and one of the best alternatives to Visio for Mac users.
                                    Process Flow Chart Symbols
Process Flow Chart is a visual diagram which shows the processes and relationships between the major components in a system, and uses for this the special process flow chart symbols: special shapes to represent different types of actions and process steps, lines and arrows to represent relationships and sequence of steps. It often named process flow diagram, it use colored flowchart symbols. It is incredibly convenient to use the ConceptDraw DIAGRAM software extended with Flowcharts Solution from the "Diagrams" Area of ConceptDraw Solution Park for designing professional looking Process Flow Charts.Cross Functional Flowchart
ConceptDraw DIAGRAM extended with Cross-Functional Flowcharts Solution from the Business Processes Area is the best software for quick and easy designing Cross Functional Flowchart of any complexity. Make sure in it right now!Value Stream Mapping Symbols
VSM symbols are the best for a production process designing. The entire Value Stream Mapping method uses a graphical representation of the manufacturing process, factors' pros and cons, that all stakeholders can easily understand. Value Stream Mapping is a graphical technique that provides possibilities to improve analysis of a manufacturing process, at the stage of the transferring information or materials that required to deliver a product or service to the customer.Fishbone Diagram Problem Solving
The Ishikawa diagram, Cause and Effect diagram, Fishbone diagram — all they are the names of one and the same visual method for working with causal connections. Originally invented by Kaoru Ishikawa to control the process quality, the Ishikawa diagram is well proven in other fields of management and personal scheduling, events planning, time management. It is a chart in the form of a fish, whose head is a problem, the fins are variants for its causes. To design easily the Fishbone diagram, you can use a special ConceptDraw DIAGRAM ector graphic and diagramming software which contains the powerful tools for Fishbone diagram problem solving offered by Fishbone Diagrams solution for the Management area of ConceptDraw Solution Park.-  Flow Chart  Of How  Communication Flows Between Stakeholders 
 - How  Communication Flows Between All Stakeholders  That Are
 -  Flow Chart  For  Communication Between All Stakeholders  That Will
 - Show By Means Of  Flow Chart  How  Communication Flows Between 
 - Produce A  Flow Chart  That Shows  Communication Between All 
 -  Flow Chart  Of How  Communication Flows Between Stakeholders 
 -  Flow Chart  How  Communication  Flow  Between All Stakeholders 
 - Basic  Flowchart  Symbols and Meaning |  Project  management life ...
 -  Project  Management Structure  Diagram 
 -  Project  management life cycle -  Flowchart  | Basic  Flowchart  Symbols ...
 - Explain  Project  Management  In Flow Chart 
 - Pyramid  Diagram  | ConceptDraw  PROJECT Project  Management ...
 -  Flowchart  For Library Management System  Project 
 - Process  Flowchart  | Data  Flow Diagram  |  Stakeholder  Management ...
 - Process  Flowchart  | Software Work Flow Process  in Project  ...
 - Hostel Management  Project  For Report Presentation Dfd Level Pdf
 - Process  Flowchart  | Data  Flow Diagram  | Structured Systems ...
 - Human Resource Development | HR  Flowchart  Symbols | Basic ...
 -  Flowchart  For Hotel Management System  Project 
 - Structure Of Organization With Block  Diagram