Organizational Structure Total Quality Management

Quality Management System
Total Quality Management with ConceptDraw

A Study of the Business Value of Total Quality Management
 Block Diagrams
Block diagrams solution extends ConceptDraw DIAGRAM software with templates, samples and libraries of vector stencils for drawing the block diagrams.
 Marketing Area
The solutions from Marketing area of ConceptDraw Solution Park collect templates, samples and libraries of vector stencils for drawing the marketing diagrams and mind maps.
 Marketing Diagrams
Marketing Diagrams solution extends ConceptDraw DIAGRAM diagramming software with abundance of samples, templates and vector design elements intended for easy graphical visualization and drawing different types of Marketing diagrams and graphs, including Branding Strategies Diagram, Five Forces Model Diagram, Decision Tree Diagram, Puzzle Diagram, Step Diagram, Process Chart, Strategy Map, Funnel Diagram, Value Chain Diagram, Ladder of Customer Loyalty Diagram, Leaky Bucket Diagram, Promotional Mix Diagram, Service-Goods Continuum Diagram, Six Markets Model Diagram, Sources of Customer Satisfaction Diagram, etc. Analyze effectively the marketing activity of your company and apply the optimal marketing methods with ConceptDraw DIAGRAM software.
Examples of Flowcharts, Org Charts and More


 Sales Dashboard
Sales Dashboard solution extends ConceptDraw DIAGRAM software with templates, samples and library of vector stencils for drawing the visual dashboards of sale metrics and key performance indicators (KPI).
HelpDesk
How to Draw a Block Diagram

Block Diagram Creator
Performance Indicators

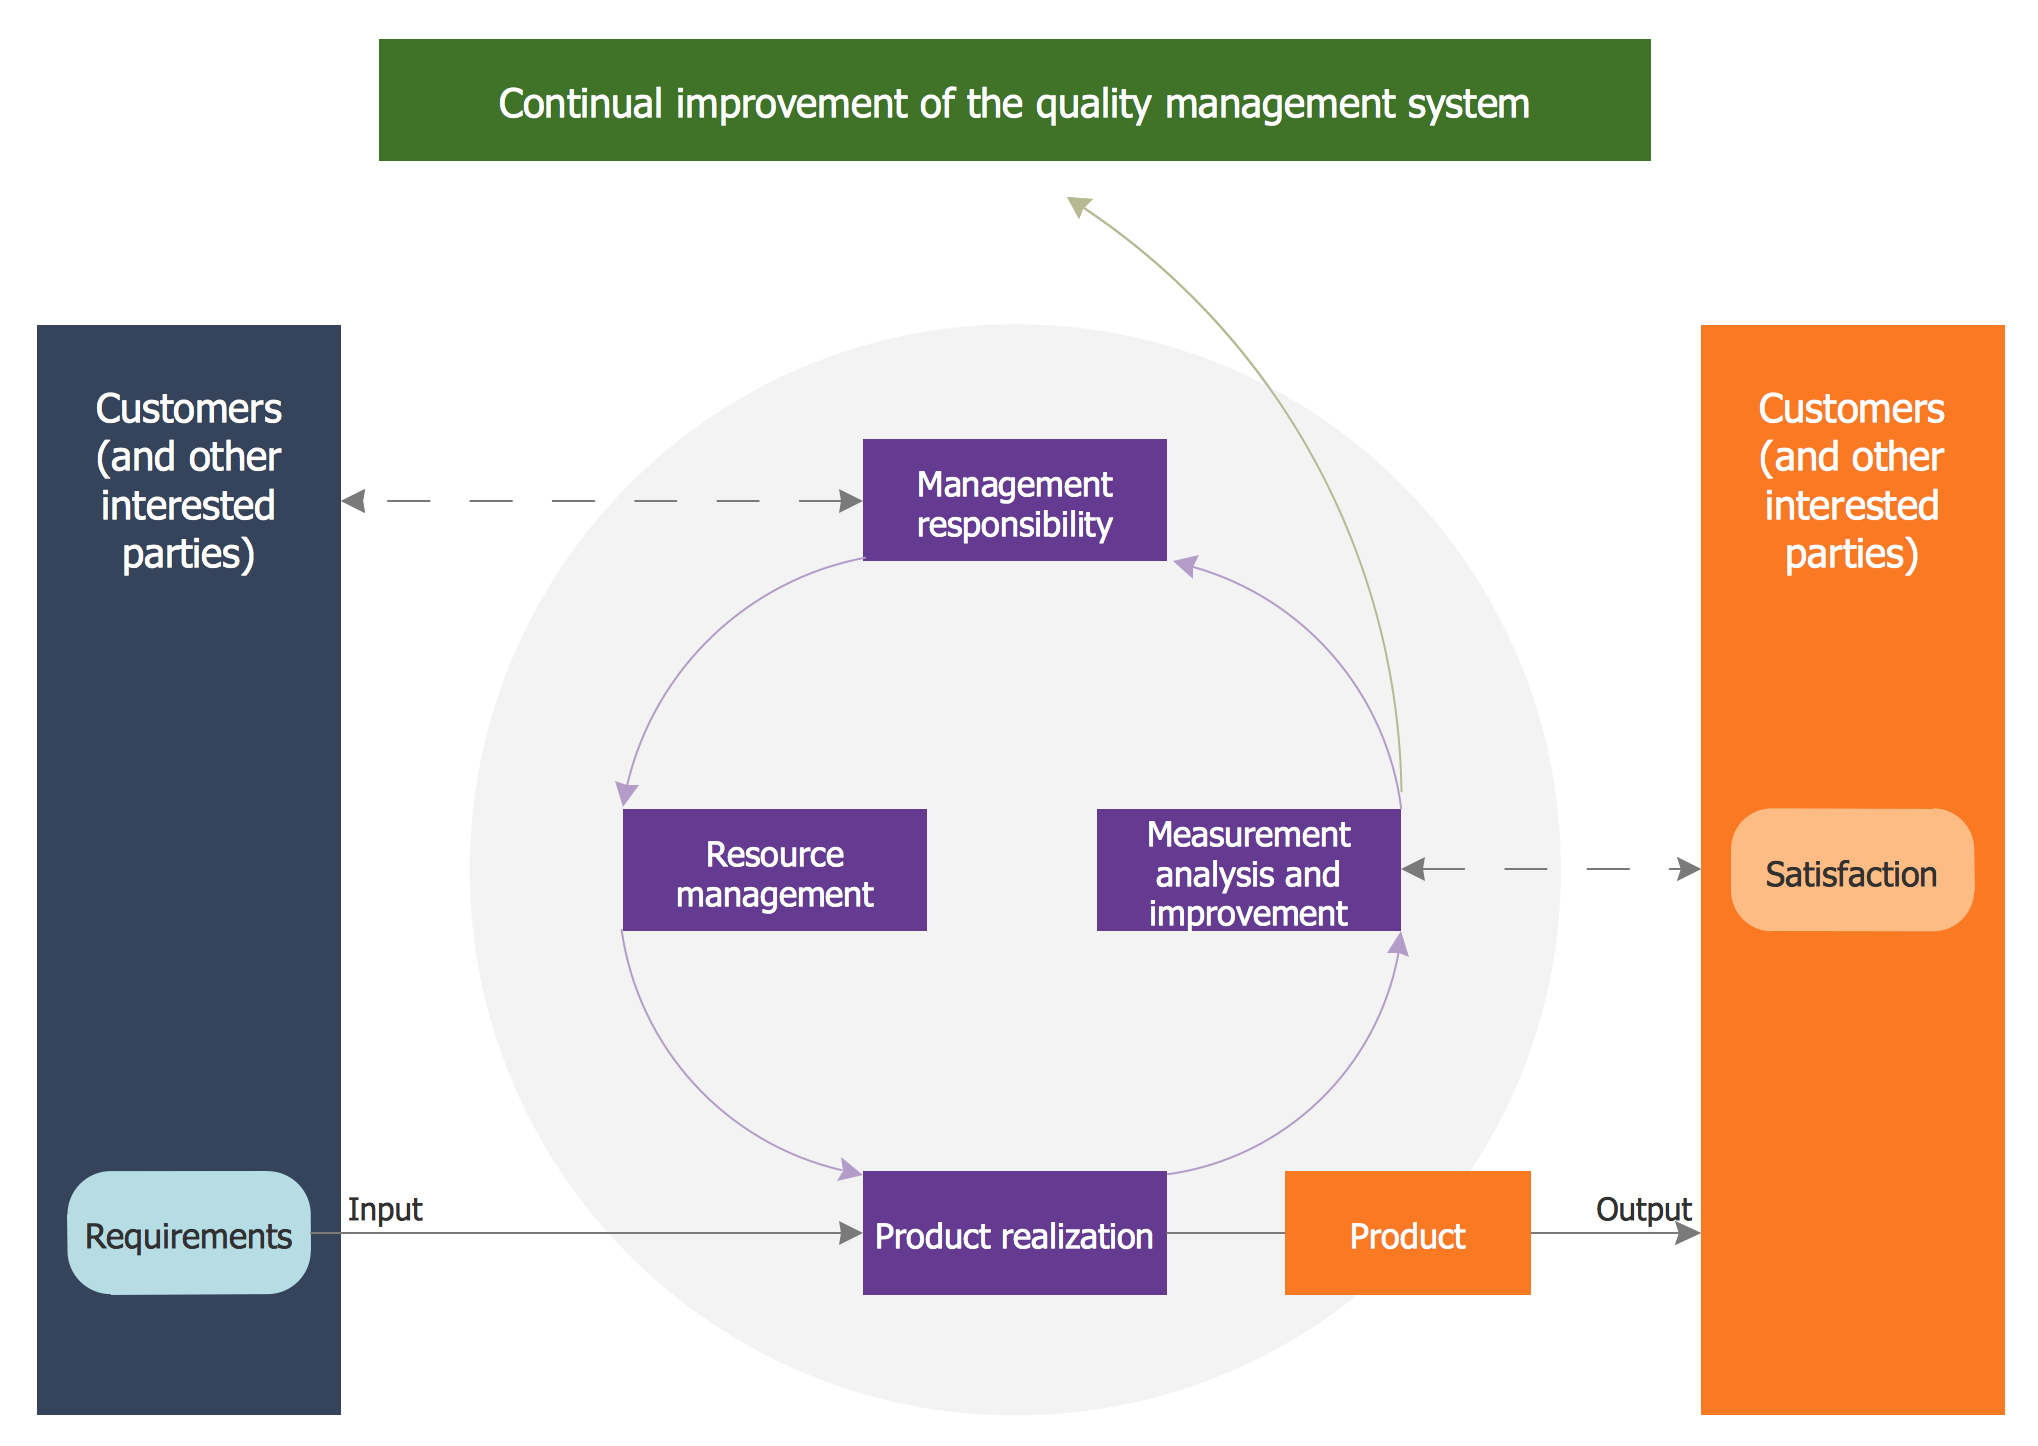
- Block diagram - Sources of customer satisfaction | Virtuous circle ...
- Block diagram - Sources of customer satisfaction | Block Diagram ...
- Block diagram - Sources of customer satisfaction | Block diagram ...
- Block diagram - Sources of customer satisfaction | IVR customer ...
- Block diagram - Sources of customer satisfaction | Marketing ...
- Block diagram - Sources of customer satisfaction | Marketing ...
- Block diagram - Sources of customer satisfaction | Block diagram ...
- Virtuous circle (management) - Ring chart | Customer Satisfaction Wiki
- Customer Retention Of Total Quality Management Flow Chart
- Customer Marketing Diagram
- Concept Map For Customer Satisfaction
- Customer Service Chart
- Basic Flowchart Symbols and Meaning | Business feedback loop ...
- Customer types matrix | Response to Customer Negative Feedback ...
- Fishbone Diagram For Customer Service
- Process Flowchart | Basic Flowchart Symbols and Meaning | Block ...
- Statification Or Flow Chart
- Positive Customer Feedback | Bank Customer Positive Feedback ...
- Workflow Diagram | Account Flowchart Stockbridge System ...
- Affinity Diagram | Accounting Information Systems Flowchart ...