This marketing diagram sample illustrates leaky bucket model.
"The leaky bucket theory. The leaky bucket theory is the model that seeks to describe the process of customer gain and loss, otherwise known as customer churn. Customer retention is one of the key concepts in relationship marketing. Most companies concentrate on recruiting new customers to replace customers who move on, rather than seeking to retain customers." [Blythe J. Key Concepts in Marketing. 2009. knowledge.sagepub.com/ view/ key-concepts-in-marketing/ n5.xml]
"Customer attrition, also known as customer churn, customer turnover, or customer defection, is the loss of clients or customers.
Banks, telephone service companies, Internet service providers, pay TV companies, insurance firms, and alarm monitoring services, often use customer attrition analysis and customer attrition rates as one of their key business metrics (along with cash flow, EBITDA, etc.) because the "...cost of retaining an existing customer is far less than acquiring a new one." Companies from these sectors often have customer service branches which attempt to win back defecting clients, because recovered long-term customers can be worth much more to a company than newly recruited clients." [Customer attrition. Wikipedia]
The chart example "Leaky bucket diagram" was created using the ConceptDraw PRO diagramming and vector drawing software extended with the Marketing Diagrams solution from the Marketing area of ConceptDraw Solution Park.
Marketing chart

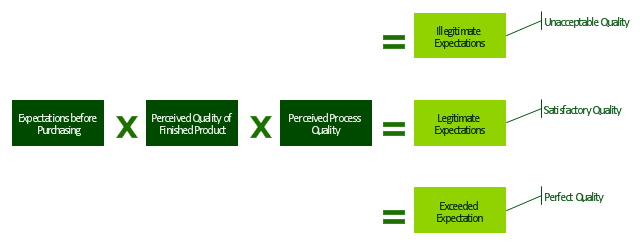
"Customer satisfaction is a term frequently used in marketing. It is a measure of how products and services supplied by a company meet or surpass customer expectation. Customer satisfaction is defined as "the number of customers, or percentage of total customers, whose reported experience with a firm, its products, or its services (ratings) exceeds specified satisfaction goals." ...
It is seen as a key performance indicator within business and is often part of a Balanced Scorecard. In a competitive marketplace where businesses compete for customers, customer satisfaction is seen as a key differentiator and increasingly has become a key element of business strategy." [Customer satisfaction. Wikipedia]
The block diagram example "Sources of customer satisfaction" was created using the ConceptDraw PRO diagramming and vector drawing software extended with the Block Diagrams solution from the area "What is a Diagram" of ConceptDraw Solution Park.
Block diagram
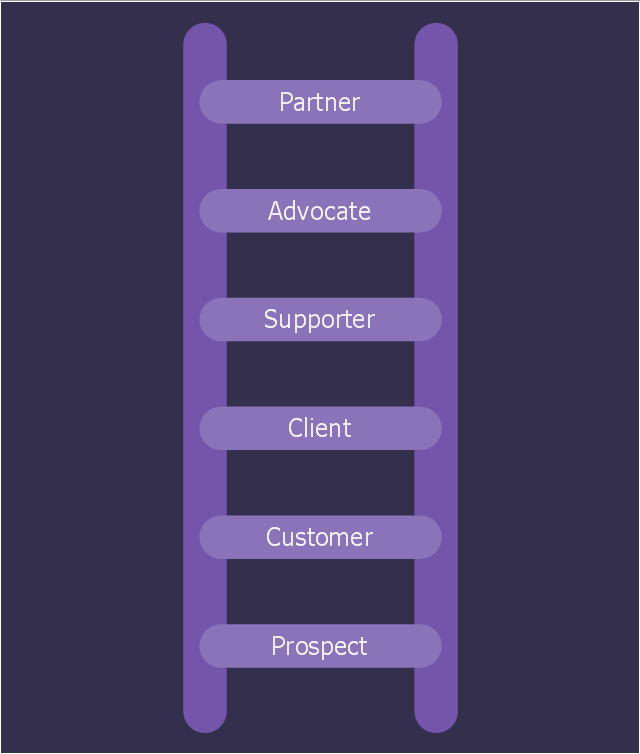
This marketing diagram visualizes how relationship marketers group customer types by level of loyalty: prospects (people that have not purchased yet but are likely to in the future), customer, client, supporter, advocate, partner.
"Relationship marketing was first defined as a form of marketing developed from direct response marketing campaigns which emphasizes customer retention and satisfaction, rather than a dominant focus on sales transactions.
As a practice, relationship marketing differs from other forms of marketing in that it recognizes the long term value of customer relationships and extends communication beyond intrusive advertising and sales promotional messages.
With the growth of the internet and mobile platforms, relationship marketing has continued to evolve and move forward as technology opens more collaborative and social communication channels. This includes tools for managing relationships with customers that goes beyond simple demographic and customer service data. Relationship marketing extends to include inbound marketing efforts, (a combination of search optimization and strategic content), PR, social media and application development." [Relationship marketing. Wikipedia]
The marketing chart example "Ladder of customer loyalty diagram" was created using ConceptDraw PRO diagramming and vector drawing software extended with Marketing Diagrams solution from Marketing area of ConceptDraw Solution Park.
Marketing diagram
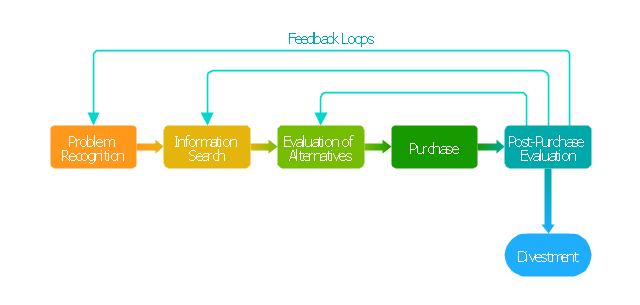
"Decision-making can be regarded as the cognitive process resulting in the selection of a belief and/ or a course of action among several alternative possibilities. Every decision-making process produces a final choice that may or may not prompt action. ...
Decision-making can also be regarded as a problem-solving activity terminated by a solution deemed to be satisfactory. It is, therefore, a reasoning or emotional process which can be rational or irrational and can be based on explicit assumptions or tacit assumptions. Most decisions are followed by some form of cost-benefit analysis. Rational choice theory encompasses the notion that people try to maximize benefits while minimizing costs.
Some have argued that most decisions are made unconsciously, if not involuntarily. Jim Nightingale, author of Think Smart – Act Smart, states that "we simply decide without thinking much about the decision process. ...
A major part of decision-making involves the analysis of a finite set of alternatives described in terms of evaluative criteria. Information overload occurs when there is a substantial gap between the capacity of information and the ways in which people may or can adapt."" [Decision-making. Wikipedia]
The block diagram example "Customer decision making" was created using the ConceptDraw PRO diagramming and vector drawing software extended with the Block Diagrams solution from the area "What is a Diagram" of ConceptDraw Solution Park.
Block diagram
Sales Process Flowchart. Flowchart Examples

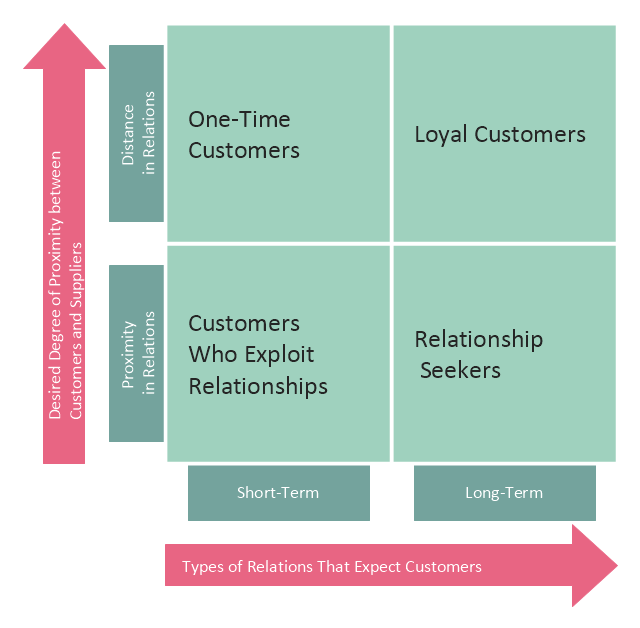
This customer types matrix diagram distribute customers into four categories depending of two criteria: 1) desired degree of proximity between customers and suppliers, and 2) types of relations that expect customers.
One time customers have short-term relations with suppliers and characterized by distance in relations with them.
Loyal customers have long-term relations with suppliers and characterized by distance in relations with them.
Customers who exploit relationships have short-term relations with suppliers and characterized by proximity in relations with them.
Relationship seekers have long-term relations with suppliers and characterized by proximity in relations with them.
This customer types matrix diagram example was created using the ConceptDraw PRO diagramming and vector drawing software extended with the Matrices solution from the Marketing area of ConceptDraw Solution Park.
Customer types diagram
UML Use Case Diagram Example. Registration System

This customer types matrix diagram distribute customers into four categories depending of two criteria: 1) desired degree of proximity between customers and suppliers, and 2) types of relations that expect customers.
One time customers have short-term relations with suppliers and characterized by distance in relations with them.
Loyal customers have long-term relations with suppliers and characterized by distance in relations with them.
Customers who exploit relationships have short-term relations with suppliers and characterized by proximity in relations with them.
Relationship seekers have long-term relations with suppliers and characterized by proximity in relations with them.
This customer types matrix diagram example was created using the ConceptDraw PRO diagramming and vector drawing software extended with the Matrices solution from the Marketing area of ConceptDraw Solution Park.
One time customers have short-term relations with suppliers and characterized by distance in relations with them.
Loyal customers have long-term relations with suppliers and characterized by distance in relations with them.
Customers who exploit relationships have short-term relations with suppliers and characterized by proximity in relations with them.
Relationship seekers have long-term relations with suppliers and characterized by proximity in relations with them.
This customer types matrix diagram example was created using the ConceptDraw PRO diagramming and vector drawing software extended with the Matrices solution from the Marketing area of ConceptDraw Solution Park.
Customer types diagram
This example of UML class diagram models bank account system.
"A bank account is a financial account between a bank customer and a financial institution. A bank account can be a deposit account, a credit card, or any other type of account offered by a financial institution. The financial transactions which have occurred within a given period of time on a bank account are reported to the customer on a bank statement and the balance of the account at any point in time is the financial position of the customer with the institution. a fund that a customer has entrusted to a bank and from which the customer can make withdrawals." [Bank account. Wikipedia]
This bank account system UML class diagram example was created using the ConceptDraw PRO diagramming and vector drawing software extended with the ATM UML Diagrams solution from the Software Development area of ConceptDraw Solution Park.
UML class diagram of bank account system

 Marketing Diagrams
Marketing Diagrams solution extends ConceptDraw DIAGRAM diagramming software with abundance of samples, templates and vector design elements intended for easy graphical visualization and drawing different types of Marketing diagrams and graphs, including Branding Strategies Diagram, Five Forces Model Diagram, Decision Tree Diagram, Puzzle Diagram, Step Diagram, Process Chart, Strategy Map, Funnel Diagram, Value Chain Diagram, Ladder of Customer Loyalty Diagram, Leaky Bucket Diagram, Promotional Mix Diagram, Service-Goods Continuum Diagram, Six Markets Model Diagram, Sources of Customer Satisfaction Diagram, etc. Analyze effectively the marketing activity of your company and apply the optimal marketing methods with ConceptDraw DIAGRAM software.
- Sequence Diagram For Customer Support System
- Draw A Diagram That Illustrates The Chain Of Customer Service
- Class UML Diagram for Bank Account System | Customer Support ...
- Diagram Of Customer Service Bank
- Workflow diagrams - Vector stencils library | Customer Service ...
- Leaky bucket diagram | Customer Defection Rate Is A Leaking Bucket
- Customer Relationship Marketing In Diagram
- Customer Loyalty Diagram Template
- Data Flow Diagram Customer Complaint
- Block Diagram Of Customer Relationship Management