This projects HR dashboard example includes the histogram of employees distribution by salary, the area chart of salari distribution, and two horizontal bar charts: "Employees by Project Teams" and "Payroll Breakdown".
"Project Portfolio Management (PPM) is the centralized management of processes, methods, and technologies used by project managers and project management offices (PMOs) to analyze and collectively manage a group of current or proposed projects based on numerous key characteristics. The objectives of PPM are to determine the optimal resource mix for delivery and to schedule activities to best achieve an organization’s operational and financial goals ― while honouring constraints imposed by customers, strategic objectives, or external real-world factors. ... With PPM, the Office of Finance can improve their accuracy for estimating and managing the financial resources of a project or group of projects. In addition, the value of projects can be demonstrated in relation to the strategic objectives and priorities of the organization through financial controls and to assess progress through earned value and other project financial techniques." [Project portfolio management. Wikipedia]
The example "Projects HR dashboard" was created using the ConceptDraw PRO diagramming and vector drawing software extended with the Frequency Distribution Dashboard solution from the area "What is a Dashboard" of ConceptDraw Solution Park.
Visual dashboard

 Business and Finance
Use Business and Finance solution to make professional-looking documents, presentations and websites, business, finance, advertising, and project management illustrations, or any designs that requires clipart of currency, office, business, advertising, management, marketing, people, time, post, contacts, collaboration, etc.
 Audit Flowcharts
Audit flowcharts solution extends ConceptDraw PRO software with templates, samples and library of vector stencils for drawing the audit and fiscal flow charts.
 Venn Diagrams
Venn Diagrams are actively used to illustrate simple set relationships in set theory and probability theory, logic and statistics, mathematics and computer science, linguistics, sociology, and marketing. Venn Diagrams are also often used to visually summarize the status and future viability of a project.
 Spatial Dashboard
Spatial dashboard solution extends ConceptDraw PRO software with templates, samples and vector stencils libraries with thematic maps for drawing visual dashboards showing spatial data.
 Sales Dashboard
Sales Dashboard solution extends ConceptDraw PRO software with templates, samples and library of vector stencils for drawing the visual dashboards of sale metrics and key performance indicators (KPI).
 Status Dashboard
Status dashboard solution extends ConceptDraw PRO software with templates, samples and vector stencils libraries with graphic indicators for drawing the visual dashboards showing status data.
 Meter Dashboard
Meter dashboard solution extends ConceptDraw PRO software with templates, samples and vector stencils library with meter indicators for drawing visual dashboards showing quantitative data.
 Frequency Distribution Dashboard
Frequency distribution dashboard solution extends ConceptDraw PRO software with samples, templates and vector stencils libraries with histograms and area charts for drawing the visual dashboards showing frequency distribution of data.
The vector stencils library "Windows 8 apps" contains 40 shortcut icons of Windows 8 software applications.
Use this shortcut UI icon set to design graphic user interface (GUI) prototypes of your software apps for Windows 8.
"In computing, a file shortcut is a handle in a user interface that allows the user to find a file or resource located in a different directory or folder from the place where the shortcut is located.
Shortcuts are typically implemented as a small file containing a target URI or GUID to an object, or the name of a target program file that the shortcut represents. The shortcut might additionally specify parameters to be passed to the target program when it is run. Each shortcut can have its own icon. Shortcuts are very commonly placed on a desktop, in an application launcher panel such as the Microsoft Windows Start menu, or in the main menu of a desktop environment. ...
File shortcuts (also known as shell links) were introduced in Windows 95. Microsoft Windows uses .lnk as the filename extension for shortcuts to local files, and .URL for shortcuts to remote files, like web pages. Commonly referred to as "shortcuts" or "link files", both are displayed with a curled arrow overlay icon by default, and no filename extension. ...
Shortcut files can be used to launch programs in minimized or maximized window states if the program supports it. ...
Beginning with Windows 7, some shortcuts also store Application User Model IDs (AppUserModelIDs). Instead of the target command line, AppUserModelIDs may directly be used to launch applications. Shortcuts with AppUserModelIDs are used by some desktop programs and all WinRT Modern apps for launching." [File shortcut. Wikipedia]
The shortcut icons example "Windows 8 apps - Vector stencils library" was created using the ConceptDraw PRO diagramming and vector drawing software extended with the Windows 8 User Interface solution from the Software Development area of ConceptDraw Solution Park.
Alarms
Calculator
Calendar
Camera

Dashboard
Database
Exel 2013
Finance
Food + Drink

Games

Health + Fitness

Help+Tips

Internet Explorer

Language

Mail

Maps
Music

News

SkyDrive
OneNote
Outlook 2013
PC Settings
People

Photos

PowerPoint 2013
Reading List

Scanner

Sound Recorder

Skype

Sports

Store
Spreadsheet
Telemetry Center

Travel

Upload Center

Video

Viewer

Visio 2013
Weather

Word 2013
 What is a Dashboard Area
Solutions from the area What is a Dashboard of ConceptDraw Solution Park collects templates, samples and vector stencils libraries with of data driven charts and indicators for drawing the basic types of Visual Dashboards.
 ConceptDraw Solution Park
ConceptDraw Solution Park collects graphic extensions, examples and learning materials
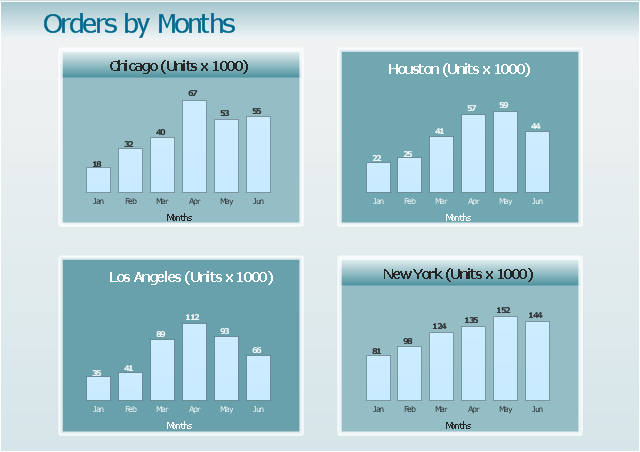
"A time series is a sequence of data points, measured typically at successive points in time spaced at uniform time intervals. ... Time series are very frequently plotted via line charts. Time series are used in statistics, signal processing, pattern recognition, econometrics, mathematical finance, weather forecasting, earthquake prediction, electroencephalography, control engineering, astronomy, and communications engineering.
Time series analysis comprises methods for analyzing time series data in order to extract meaningful statistics and other characteristics of the data. Time series forecasting is the use of a model to predict future values based on previously observed values." [Time series. Wikipedia]
The example "Orders by months - Time series dashboard" was created using the ConceptDraw PRO diagramming and vector drawing software extended with the Time Series Dashboard solution from the area "What is a Dashboard" of ConceptDraw Solution Park.
Order by months - Time series dashboard
"A performance indicator or key performance indicator (KPI) is a type of performance measurement. An organization may use KPIs to evaluate its success, or to evaluate the success of a particular activity in which it is engaged. Sometimes success is defined in terms of making progress toward strategic goals, but often success is simply the repeated, periodic achievement of some level of operational goal (e.g. zero defects, 10/ 10 customer satisfaction, etc.). Accordingly, choosing the right KPIs relies upon a good understanding of what is important to the organization. 'What is important' often depends on the department measuring the performance - e.g. the KPIs useful to finance will be quite different from the KPIs assigned to sales. Since there is a need to understand well what is important (to an organization), various techniques to assess the present state of the business, and its key activities, are associated with the selection of performance indicators. These assessments often lead to the identification of potential improvements, so performance indicators are routinely associated with 'performance improvement' initiatives." [Performance indicator. Wikipedia]
The example "Website KPIs - Visual dashboard" was created using the ConceptDraw PRO diagramming and vector drawing software extended with the Composition Dashboard solution from the area "What is a Dashboard" of ConceptDraw Solution Park.
The example "Website KPIs - Visual dashboard" was created using the ConceptDraw PRO diagramming and vector drawing software extended with the Composition Dashboard solution from the area "What is a Dashboard" of ConceptDraw Solution Park.
Visual dashboard

 ConceptDraw Dashboard for Facebook
ConceptDraw Dashboard for Facebook solution extends ConceptDraw PRO software with a dynamically updated visual dashboard, which shows lifetime total likes, daily friends of fans, and daily page views, information you can receive from Facebook Insights.
- PM Dashboards | How To Create Project Report | Project ...
- Status Dashboard | Projects HR dashboard | Project tasks ...
- Types of Flowchart - Overview | Process Flowchart | HR Flowcharts ...
- Dashboard Images
- Projects HR dashboard | Competitor Analysis | Hr Portfolio Examples
- Business and Finance | Pie Chart Maker Using Currency
- Employee distribution - HR dashboard | Projects HR dashboard ...
- Status Dashboard | PM Dashboards | Sales Dashboard Examples ...
- Employee distribution - HR dashboard | Frequency Distribution ...
- Time Series Dashboard Solution
- Bar Graphs | Business and Finance | Cross-Functional Flowcharts ...
- Business and Finance | Picture Graphs | Aerospace and Transport ...
- Enterprise dashboard | Meter Dashboard | Website KPIs - Visual ...
- Enterprise dashboard | KPI Dashboard | Time Series Dashboard ...
- Business Process Diagrams | Marketing Diagrams | Business and ...
- Composition Dashboard | What are Infographic Area | How To ...
- Cafe performance metrics vs. air temperature - Visual dashboard ...
- Deployment Diagram For Online Shopping Dashboard
- Performance Indicators | Constant improvement of key performance ...
- A KPI Dashboard | A KPI Dashboard Provides the Answers Your ...