A four level pyramid model of different types of Information Systems based on the different levels of hierarchy in an organization. The first level represents transaction processing systems for workers. The second level represents management information systems for middle managers. The third level represents decision support systems for senior menegers. The fourth level represents executive information systems for executives.
"The "classic" view of Information systems found in the textbooks in the 1980s was of a pyramid of systems that reflected the hierarchy of the organization, usually transaction processing systems at the bottom of the pyramid, followed by management information systems, decision support systems, and ending with executive information systems at the top. Although the pyramid model remains useful, since it was first formulated a number of new technologies have been developed and new categories of information systems have emerged, some of which no longer fit easily into the original pyramid model.
Some examples of such systems are:
data warehouses,
enterprise resource planning,
enterprise systems,
expert systems,
search engines,
geographic information system,
global information system,
office automation." [Information systems. Wikipedia]
This diagram was redesigned using the ConceptDraw PRO diagramming and vector drawing software from Wikimedia Commons file Four-Level-Pyramid-model.png. [commons.wikimedia.org/ wiki/ File:Four-Level-Pyramid-model.png]
This file is licensed under the Creative Commons Attribution-Share Alike 3.0 Unported license. [creativecommons.org/ licenses/ by-sa/ 3.0/ deed.en]
The triangle chart example "Information systems types" is included in the Pyramid Diagrams solution from the Marketing area of ConceptDraw Solution Park.
Pyramid diagram

A five level pyramid model of different types of Information Systems based on the information processing requirement of different levels in the organization. The first level represents transaction processing systems to process basic data. The second level represents office support systems to process information in office. The third level represents management information systems to process information by managers. The fourth level represents decision support systems to process explicit knowledge. The fifth level represents executive information systems to process tacit knowledge.
"A Computer(-Based) Information System is essentially an IS using computer technology to carry out some or all of its planned tasks. The basic components of computer based information system are:
(1) Hardware - these are the devices like the monitor, processor, printer and keyboard, all of which work together to accept, process, show data and information.
(2) Software - are the programs that allow the hardware to process the data.
(3) Databases - are the gathering of associated files or tables containing related data.
(4) Networks - are a connecting system that allows diverse computers to distribute resources.
(5) Procedures - are the commands for combining the components above to process information and produce the preferred output.
The first four components (hardware, software, database and network) make up what is known as the information technology platform. Information technology workers could then use these components to create information systems that watch over safety measures, risk and the management of data. These actions are known as information technology services." [Information systems. Wikipedia]
This pyramid diagram was redesigned using the ConceptDraw PRO diagramming and vector drawing software from Wikimedia Commons file Five-Level-Pyramid-model.png. [commons.wikimedia.org/ wiki/ File:Five-Level-Pyramid-model.png]
This file is licensed under the Creative Commons Attribution 3.0 Unported license. [creativecommons.org/ licenses/ by/ 3.0/ deed.en]
The triangle chart example "Information systems types" is included in the Pyramid Diagrams solution from the Marketing area of ConceptDraw Solution Park.
Pyramid diagram

This circular arrows diagram sample shows the systems development life cycle (SDLC) stages.
"The systems development life cycle (SDLC), also referred to as the application development life-cycle, is a term used in systems engineering, information systems and software engineering to describe a process for planning, creating, testing, and deploying an information system. The systems development life-cycle concept applies to a range of hardware and software configurations, as a system can be composed of hardware only, software only, or a combination of both." [Systems development life-cycle. Wikipedia]
The arrow circle diagram example "Systems development life cycle" was created using the ConceptDraw PRO diagramming and vector drawing software extended with the Circular Arrows Diagrams solution from the area "What is a Diagram" of ConceptDraw Solution Park.
Circular arrows diagram

The vector stencils library "Bank UML deployment diagram" contains 10 shapes for drawing UML deployment diagrams.
Use it for object-oriented modeling of your bank information system.
"A deployment diagram in the Unified Modeling Language models the physical deployment of artifacts on nodes. To describe a web site, for example, a deployment diagram would show what hardware components ("nodes") exist (e.g., a web server, an application server, and a database server), what software components ("artifacts") run on each node (e.g., web application, database), and how the different pieces are connected (e.g. JDBC, REST, RMI).
The nodes appear as boxes, and the artifacts allocated to each node appear as rectangles within the boxes. Nodes may have subnodes, which appear as nested boxes. A single node in a deployment diagram may conceptually represent multiple physical nodes, such as a cluster of database servers.
There are two types of Nodes:
1. Device Node.
2. Execution Environment Node.
Device nodes are physical computing resources with processing memory and services to execute software, such as typical computers or mobile phones. An execution environment node (EEN) is a software computing resource that runs within an outer node and which itself provides a service to host and execute other executable software elements." [Deployment diagram. Wikipedia]
This example of UML deployment diagram symbols for the ConceptDraw PRO diagramming and vector drawing software is included in the ATM UML Diagrams solution from the Software Development area of ConceptDraw Solution Park.
UML deployment diagram symbols

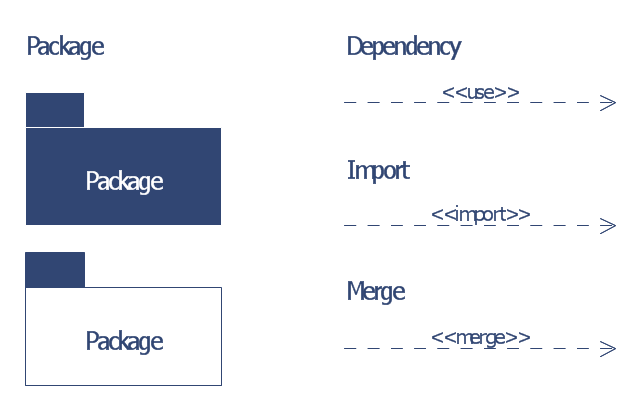
The vector stencils library "Bank UML package diagram" contains 5 shapes for drawing UML package diagrams.
Use it for object-oriented modeling of your bank information system.
"A package diagram in the Unified Modeling Language depicts the dependencies between the packages that make up a model.
In addition to the standard UML Dependency relationship, there are two special types of dependencies defined between packages:
* package import,
* package merge.
Elements.
1. Package: a general purpose mechanism for organizing model elements & diagrams into groups. It provides an encapsulated namespace within which all the names must be unique. It is used to group semantically related elements. It is a namespace as well as an element that can be contained in other packages' namespaces.
2. Class: a representation of an object that reflects its structure and behavior within the system. It is a template from which running instances are created. Classes usually describe the logical structure of the system.
3. Interface: a specification of behavior. An implementation class must be written to support the behavior of an interface class.
4. Object: an instance of a class. It is often used in analysis to represent an artifact or other item.
5. Table: a stereotyped class." [Package diagram. Wikipedia]
This example of UML package diagram symbols for the ConceptDraw PRO diagramming and vector drawing software is included in the ATM UML Diagrams solution from the Software Development area of ConceptDraw Solution Park.
UML package diagram symbols
 Entity-Relationship Diagram (ERD)
Entity-Relationship Diagram (ERD) solution extends ConceptDraw PRO software with templates, samples and libraries of vector stencils from drawing the ER-diagrams by Chen's and crow’s foot notations.
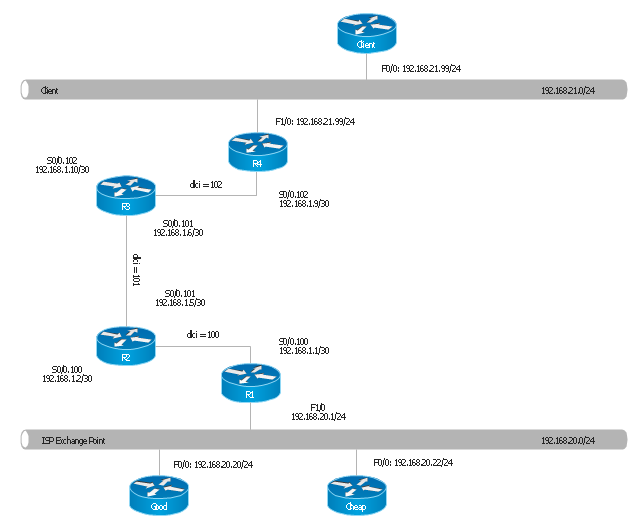
"Logical topology, or signal topology, is the arrangement of devices on a computer network and how they communicate with one another. How devices are connected to the network through the actual cables that transmit data, or the physical structure of the network, is called the physical topology. Physical topology defines how the systems are physically connected. It represents the physical layout of the devices on the network. The logical topology defines how the systems communicate across the physical topologies.
Logical topologies are bound to network protocols and describe how data is moved across the network. ...
EXAMPLE : twisted pair Ethernet is a logical bus topology in a physical star topology layout. while IBM's token ring is a logical ring topology, it is physically set up in star topology." [Logical topology. Wikipedia]
This Cisco logical computer network diagram example was created using the ConceptDraw PRO diagramming and vector drawing software extended with the Cisco Network Diagrams solution from the Computer and Networks area of ConceptDraw Solution Park.
Logical network topology diagram
- 4 Level pyramid model diagram - Information systems types | 5 Level ...
- 4 Level pyramid model diagram - Information systems types ...
- Chart Of Management Information System With Diagram
- With The Aid Of Diagram Explain Management Information System
- 4 Level pyramid model diagram - Information systems types ...
- Diagram That Explain Information System
- 4 Level pyramid model diagram - Information systems types ...
- Pyramid Diagram | 4 Level pyramid model diagram - Information ...
- 4 Level pyramid model diagram - Information systems types ...
- Pyramid Diagram | 5 Level pyramid model diagram - Information ...
- Pyramid Diagram | 4 Level pyramid model diagram - Information ...
- 4 Level pyramid model diagram - Information systems types ...
- 4 Level pyramid model diagram - Information systems types ...
- Pyramid Diagram | 4 Level pyramid model diagram - Information ...
- Pyramid Diagram | 4 Level pyramid model diagram - Information ...
- Pyramid Diagram | Process Flowchart | Pyramid Diagram | Explain ...
- 4 Level pyramid model diagram - Information systems types ...
- 4 Level pyramid model diagram - Information systems types | 5 Level ...
- 4 Level pyramid model diagram - Information systems types | 5 Level ...
- 4 Level pyramid model diagram - Information systems types ...