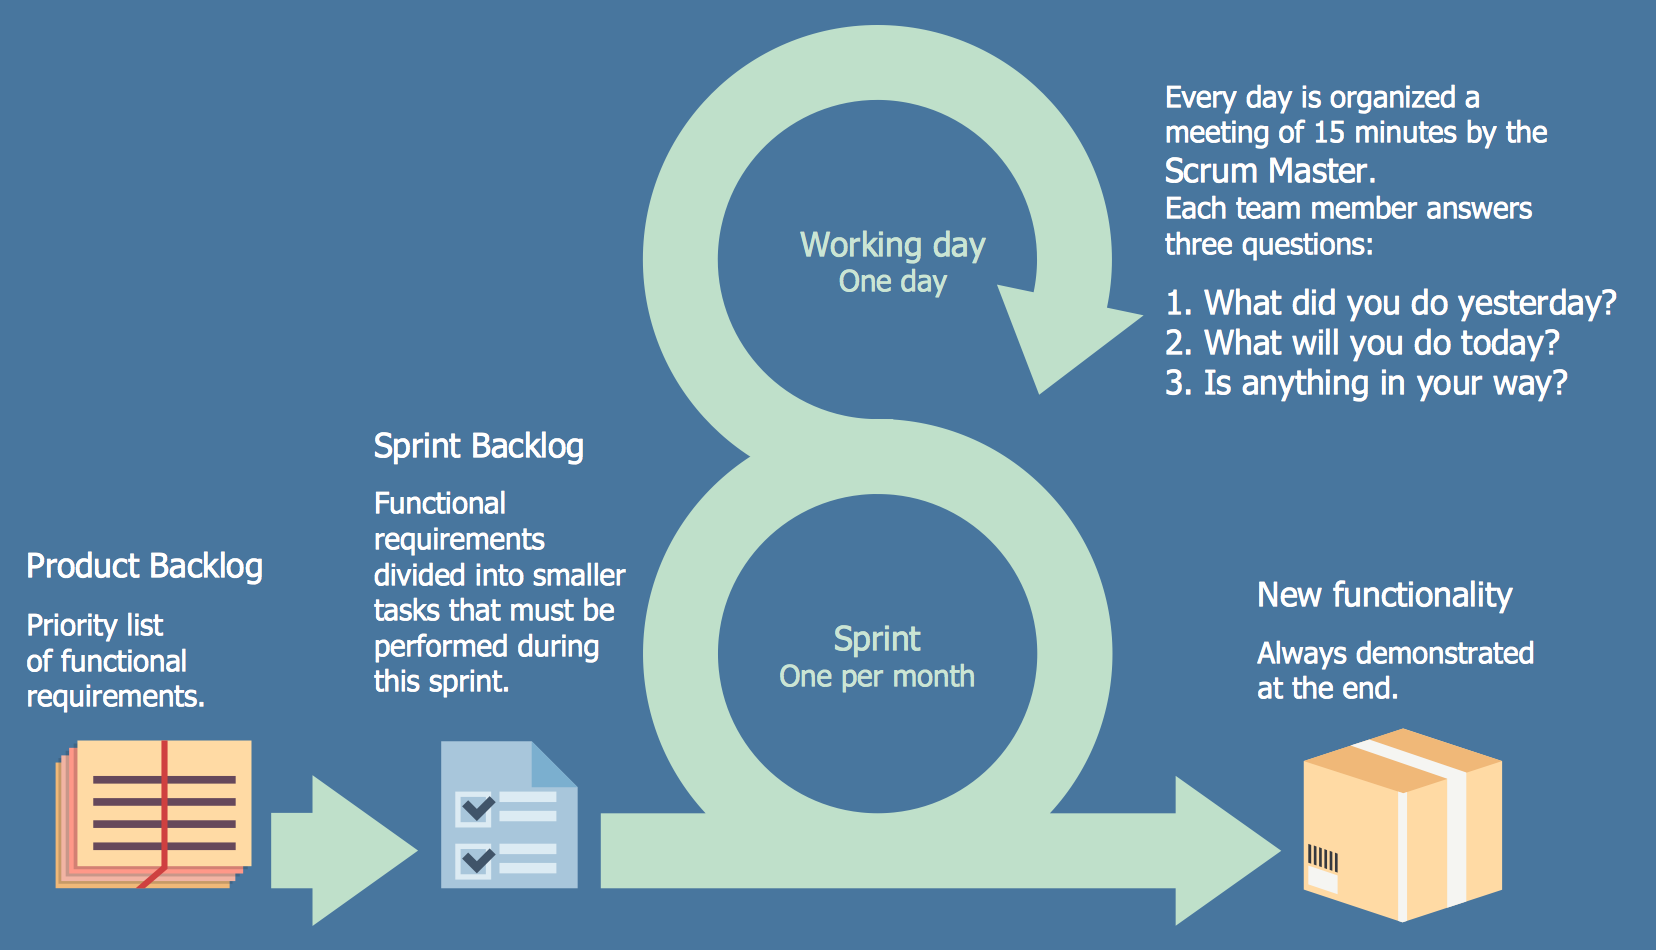
Scrum workflow
Android GUI

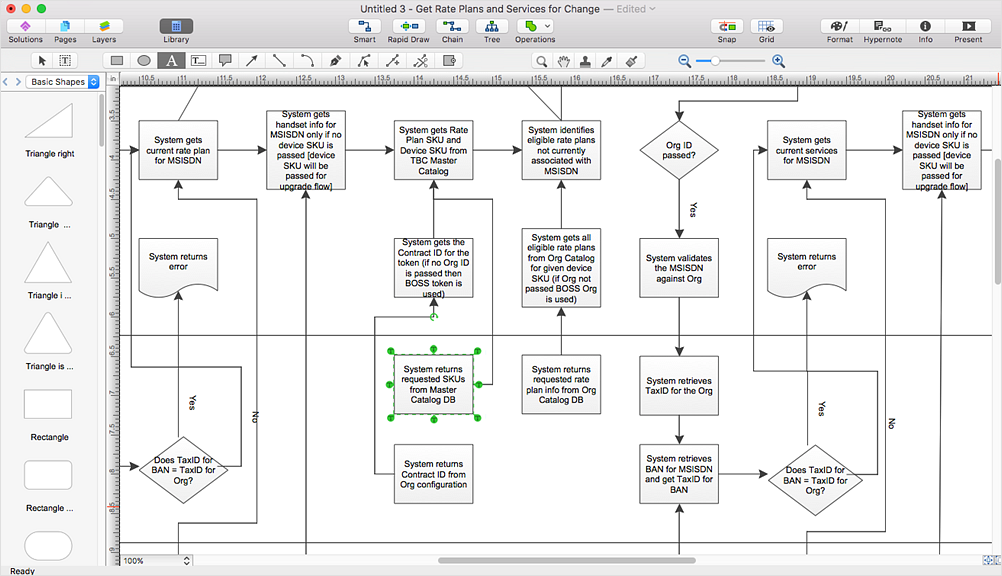
ConceptDraw DIAGRAM Compatibility with MS Visio

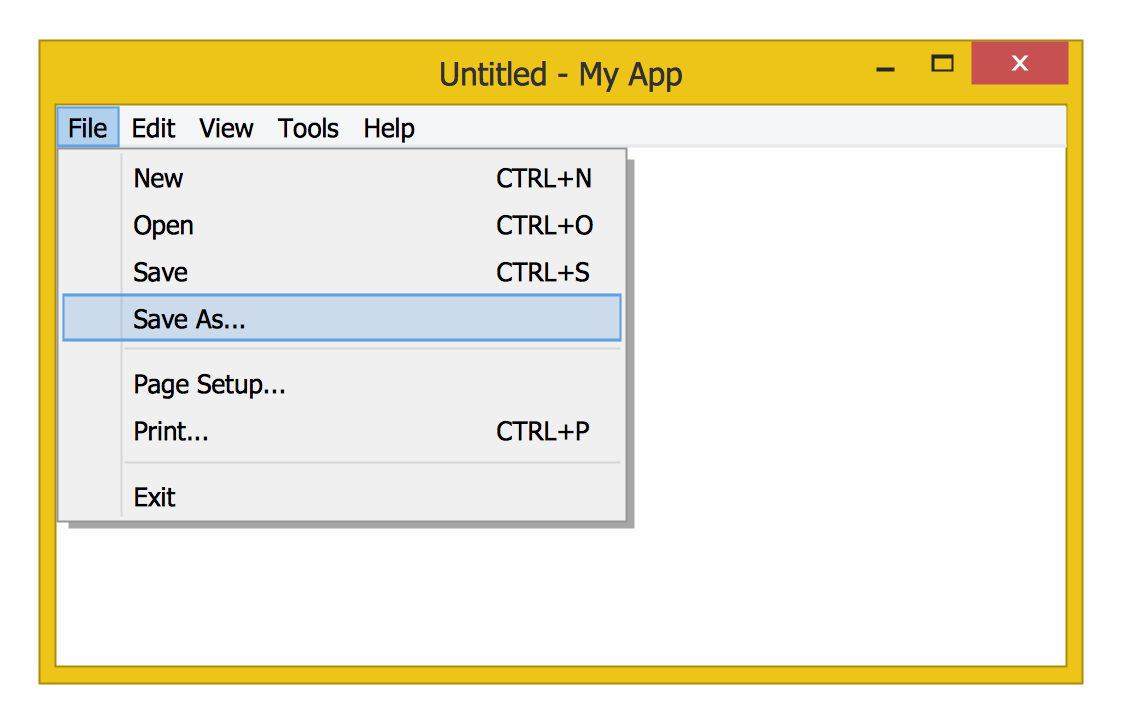
Windows 8 UI Design Patterns
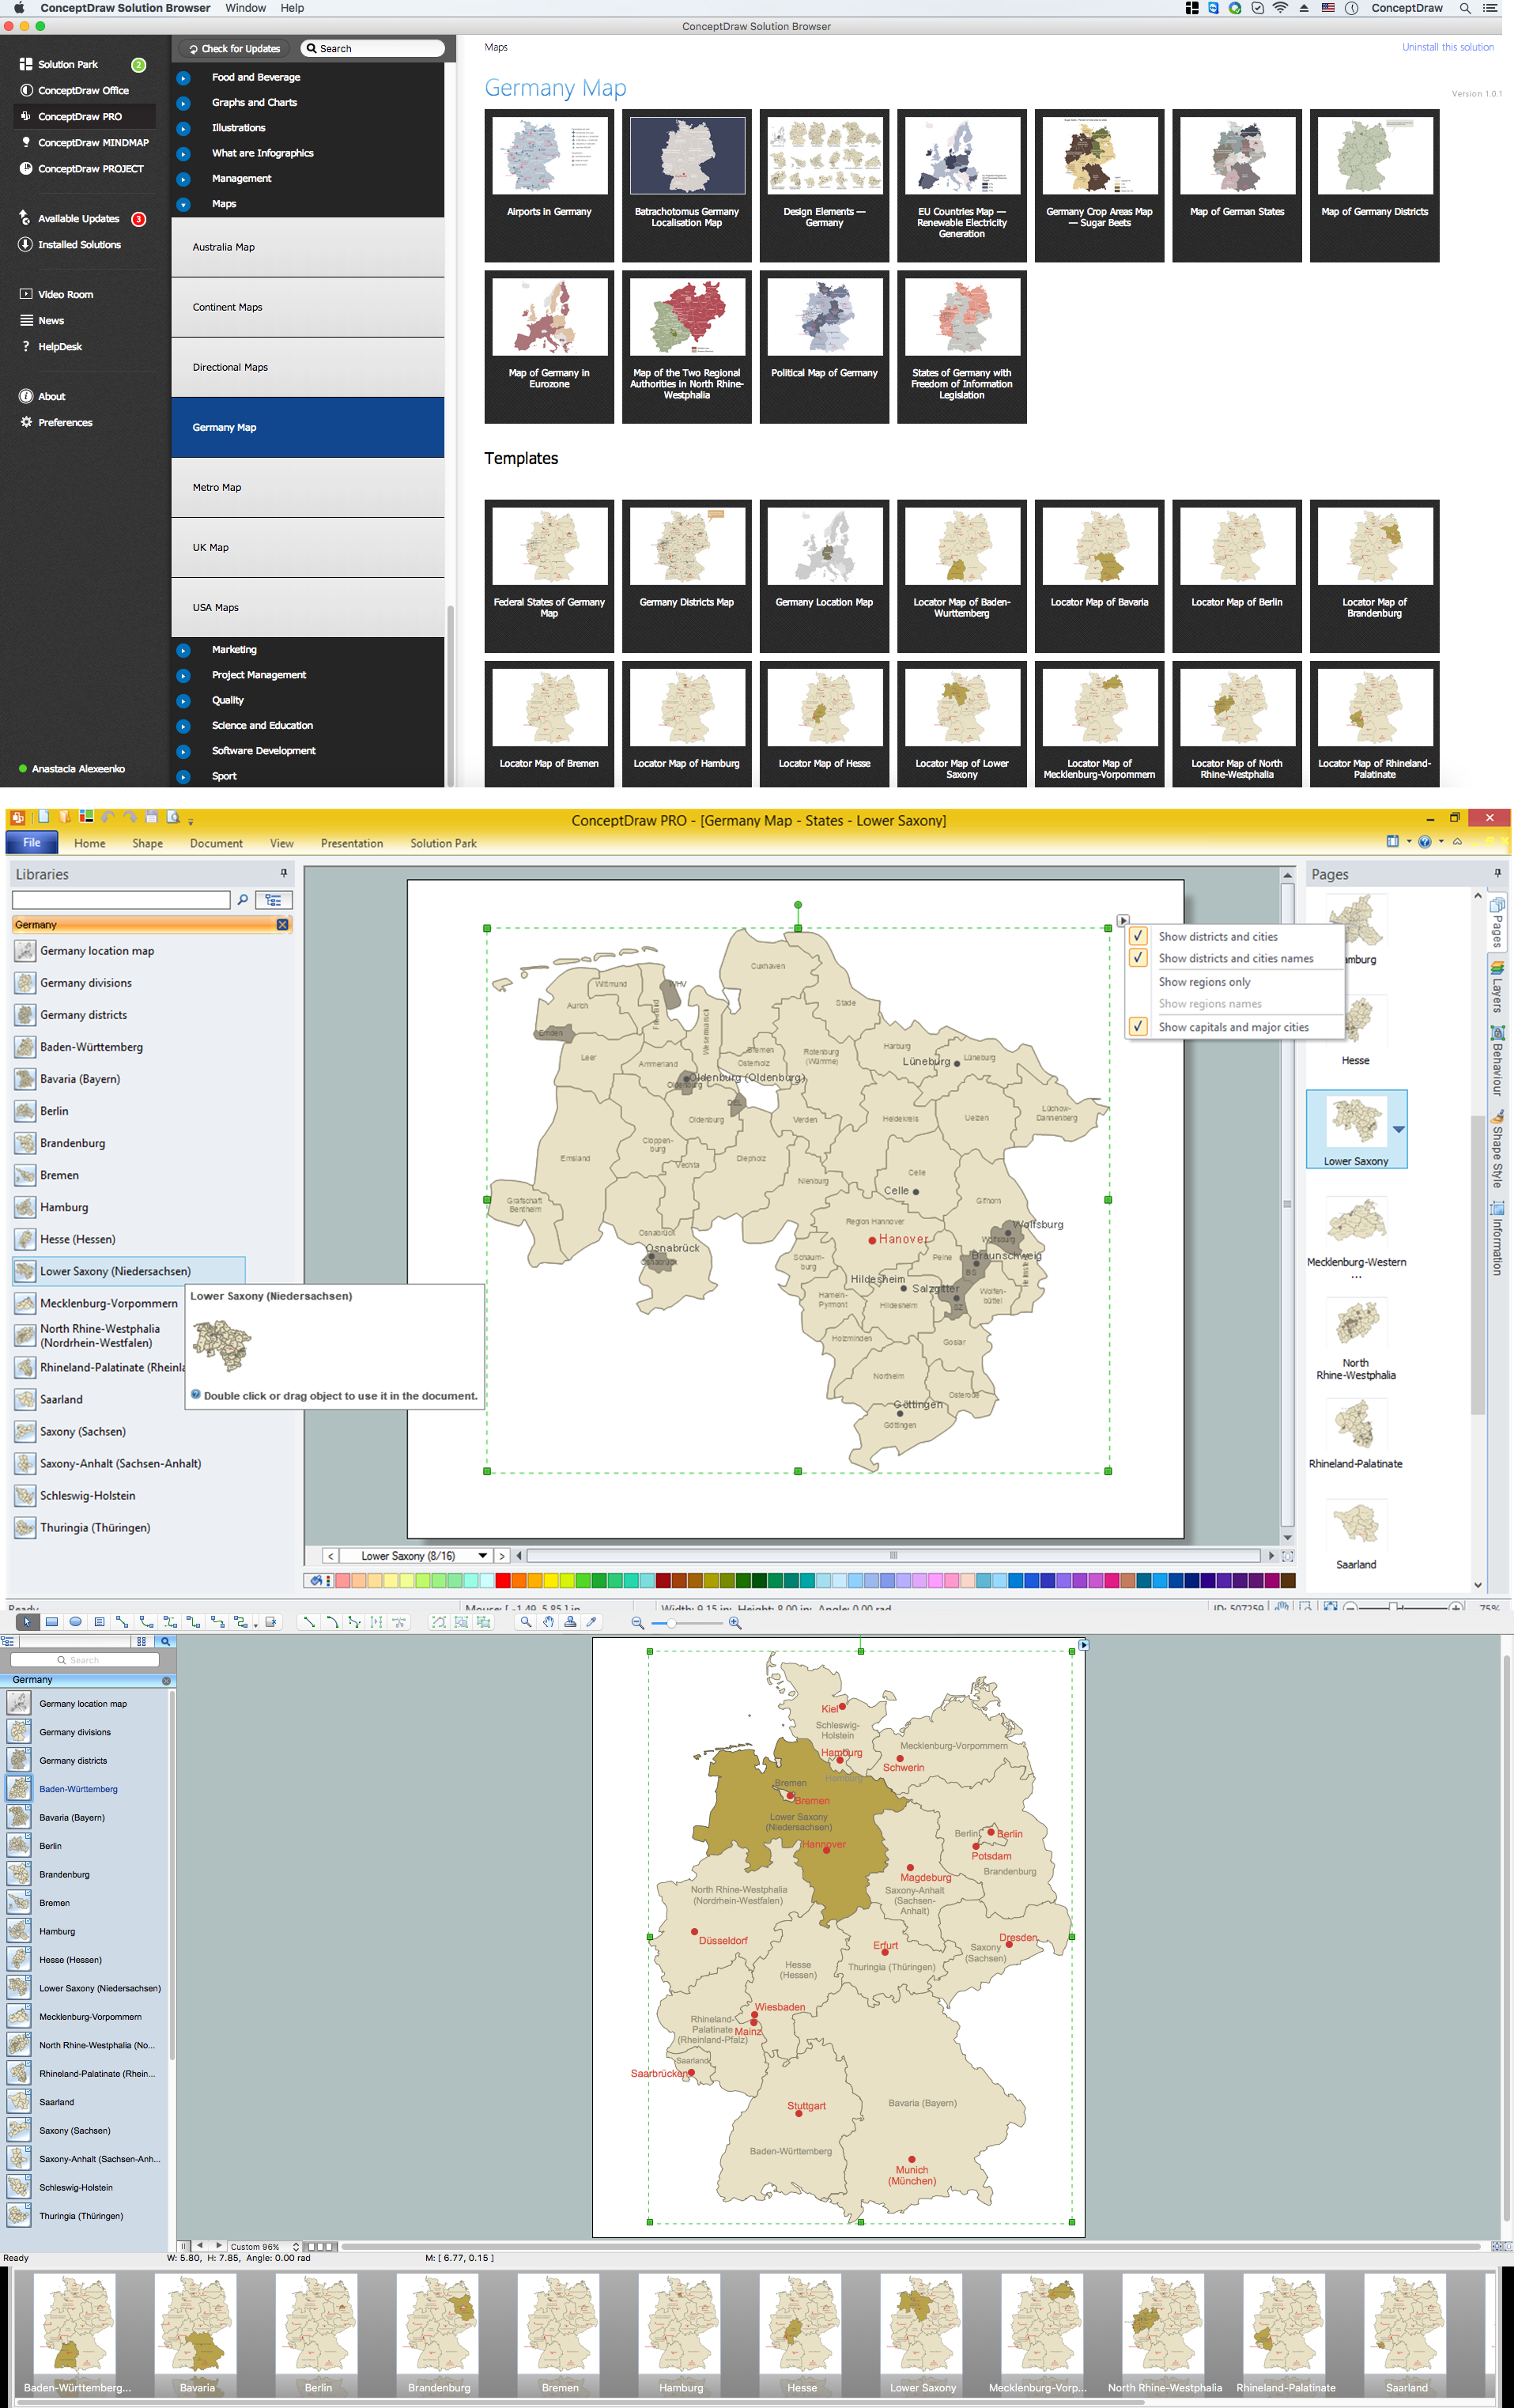
Map of Germany — Lower Saxony State
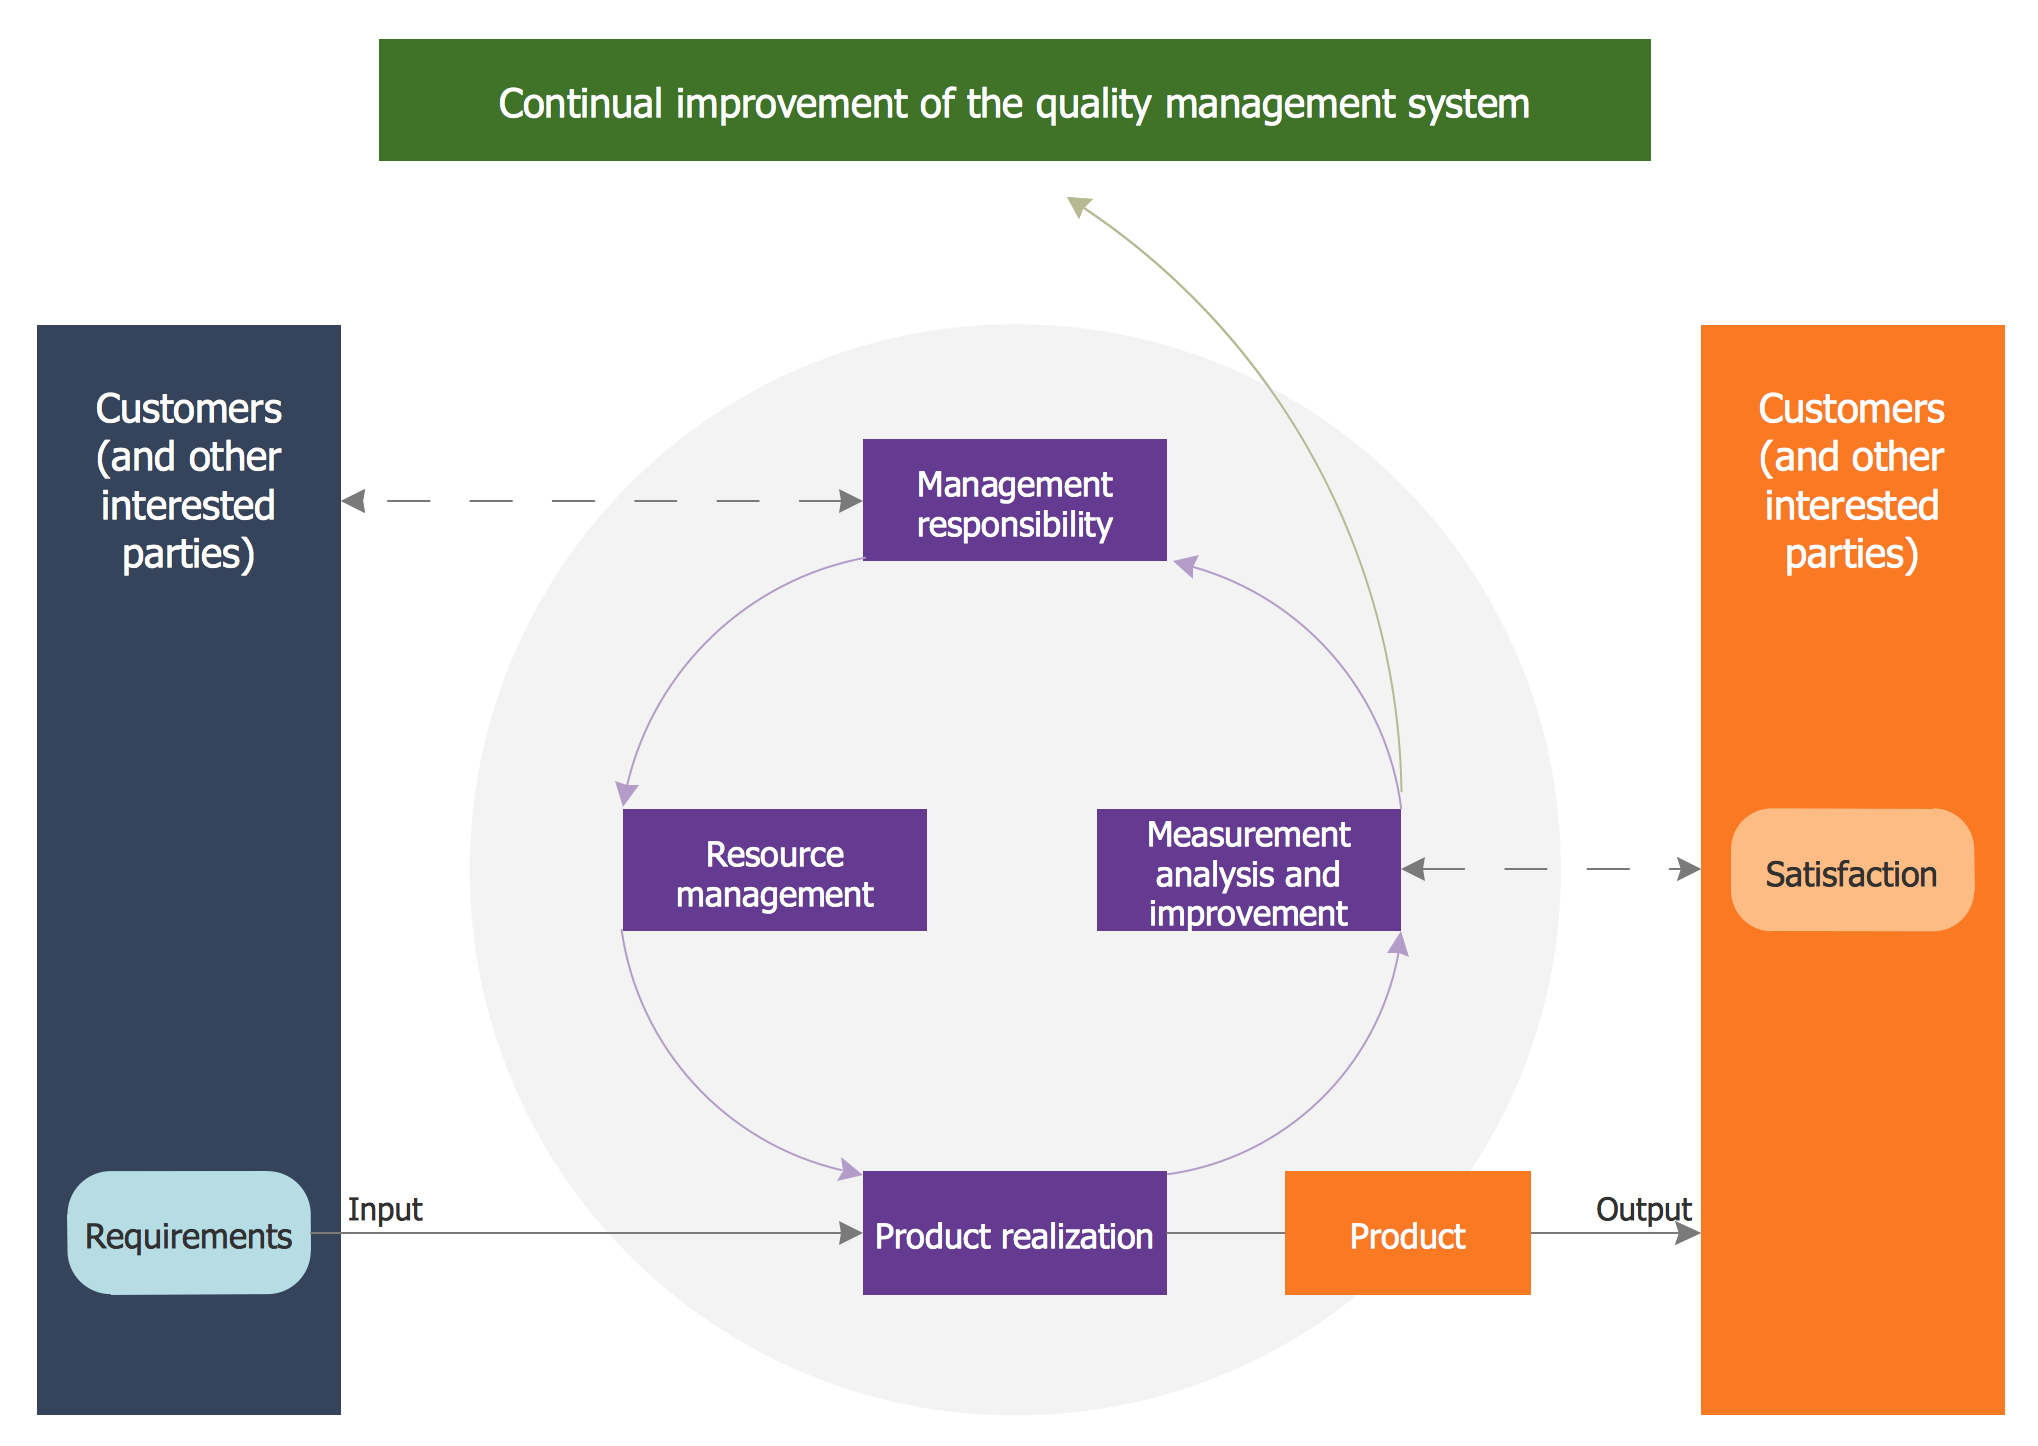
Quality Management System
HelpDesk
How to Open MS Visio® 2013/2016 Files on a Mac®
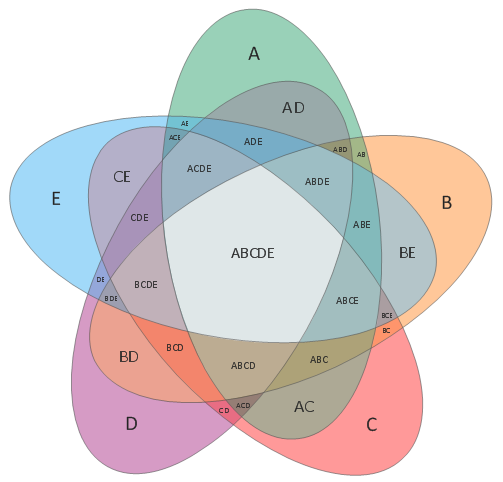
Venn Diagram Template
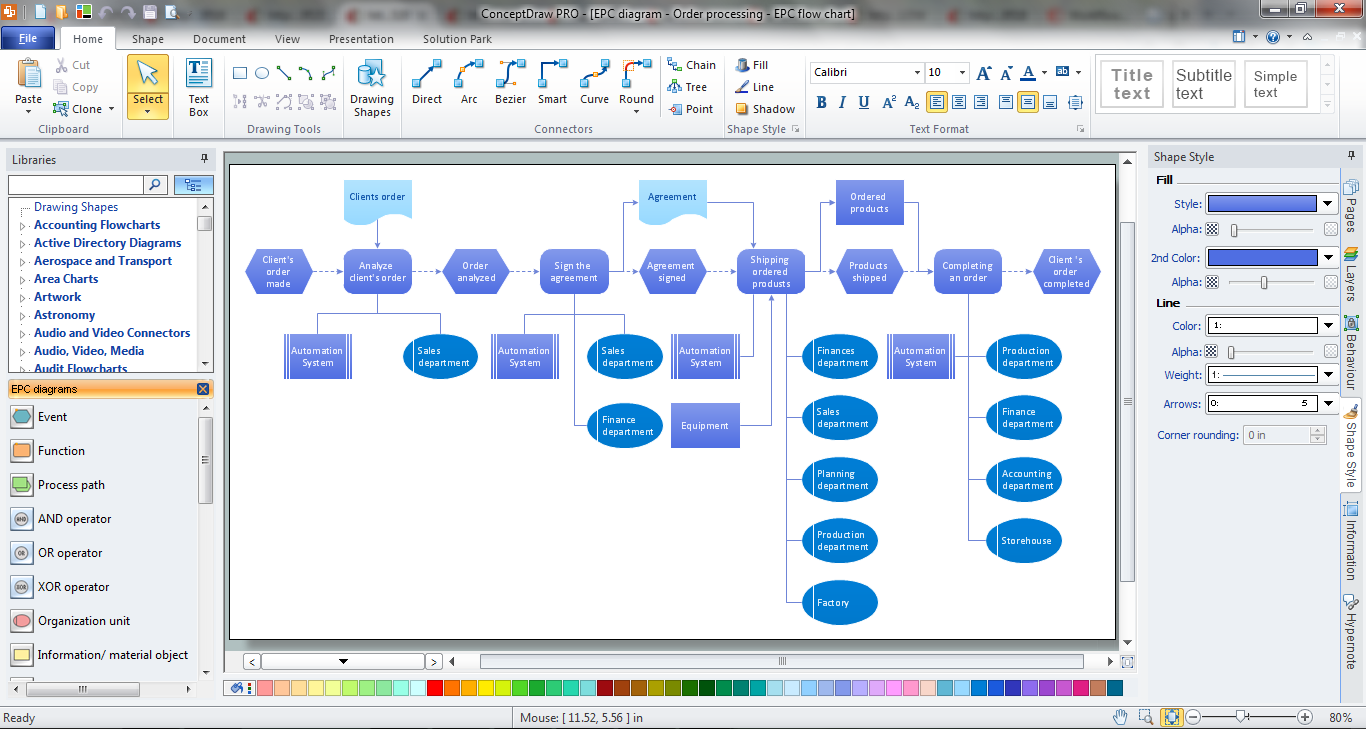
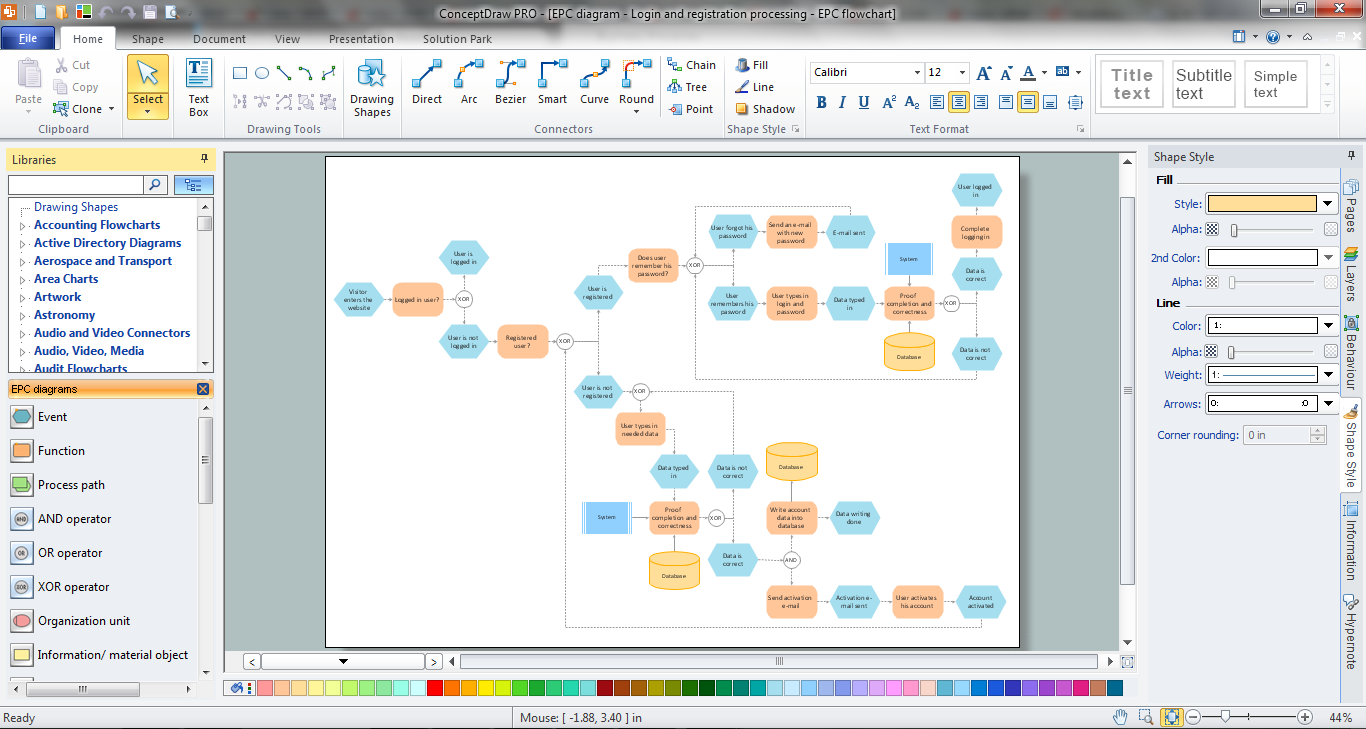
EPC IT Solutions
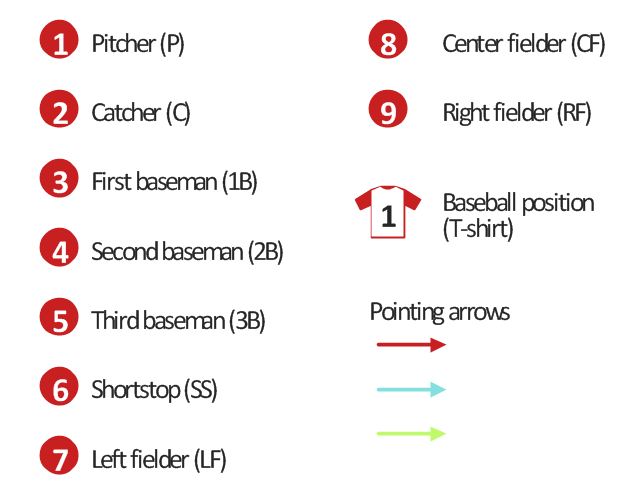
The vector stencils library "Baseball positions" contains 13 symbols: pitcher, catcher, first baseman, second baseman, third baseman, shortstop, left fielder, center fielder, right fielder, baseball position, pointing arrows.
"Baseball is unlike most other competitive sports in that the defense is given control of the ball. Additionally, the number of players on the field at any given time is lopsided in favor of the defense which always has nine players on the field; the offense has between one and four. ...
Each play starts with the ball in the hands of the pitcher, whose job as a member of the defense is to use his skills to somehow prevent the batter from reaching base. The pitcher throws the ball toward the catcher, whose must catch the pitched ball if it is not hit by the batter. In each half-inning, the defense attempts to force three outs.
There are three basic ways in which an out can occur: 1.) If three strikes are recorded against the batter, 2.) if a ball hit by a batter is caught by a defensive player before it hits the ground, or 3.) if a runner who is between bases or has not reached a base to which he is forced is put out by a defensive player in possession of the ball.
If the batter manages to hit the ball, all nine defensive players become active and use the ball in attempting to prevent the batter from reaching base and runners already on base from advancing or scoring. while the offense is busy attempting to move runners around the baseball diamond toward home plate, the defense uses the ball in various ways to achieve outs.
If the defense forces three outs, their team is moved into the offensive role. The exception is if it is the ninth or an extra inning and they are ahead, in which case, the game ends and the defensive team wins." [Defense (sports). Wikipedia]
The symbols example "Design elements - Baseball positions" was created using the ConceptDraw PRO diagramming and vector drawing software extended with the Baseball solution from the Sport area of ConceptDraw Solution Park.
Baseball positions diagram symbols
Pie Chart Examples and Templates

Work Flow Process Chart

 Wireless Networks
The Wireless Networks Solution extends ConceptDraw DIAGRAM software with professional diagramming tools, set of wireless network diagram templates and samples, comprehensive library of wireless communications and WLAN objects to help network engineers and designers efficiently design and create Wireless network diagrams that illustrate wireless networks of any speed and complexity, and help to identify all required equipment for construction and updating wireless networks, and calculating their costs.
EPC
ConceptDraw DIAGRAM

- Xml Icon In Visio
- Square Msg Icon Png
- Basic Flowchart Symbols and Meaning | Network Icon | Cisco WAN ...
- Visio User Icon
- Iphone App Icon Pic
- Management By Exception Flow Chart
- Programmer Icon Visio
- Microsoft Icon Software Icon
- Many Apps Icon
- Flowchart design. Flowchart symbols, shapes, stencils and icons ...
- AWS Simple Icons for Architecture Diagrams | Design elements ...
- Network Icons | Cisco Multimedia, Voice, Phone. Cisco icons ...
- Network Glossary Definition | Network Icon | Network Diagramming ...
- Business Icon
- Population Icon
- Visio Smartphone Icon With White Background
- Electronic Devices Icon Diagram
- Design elements - Android system icons (content) | Android 5.0 ...
- Cisco Buildings. Cisco icons , shapes, stencils and symbols | Cisco ...