 Fault Tree Analysis Diagrams
This solution extends ConceptDraw DIAGRAM.5 or later with templates, fault tree analysis example, samples and a library of vector design elements for drawing FTA diagrams (or negative analytical trees), cause and effect diagrams and fault tree diagrams.
The accident analysis diagram example "Accident analytic tree" was redesigned from the picture 7-14 from the "DOE Workbook. Conducting Accident Investigations. Revision 2."
"Analytic tree analyses are well defined, useful methods that graphically depict, from beginning to end, the events and conditions preceding and immediately following an accident. An analytic tree is a means of organizing information that helps the investigator conduct a deductive analysis of any system (human, equipment, or environmental) to determine critical paths of success and failure. Results from this analysis identify the details and interrelationships that must be considered to prevent the oversights, errors, and omissions that lead to failures. In accident investigations, this type of analysis can consist of both failure paths and success paths, and can lead to neutral, negative, or positive conclusions regarding accident severity.
TIP.
An analytic tree enables the user to:
(1) Systematically identify the possible paths from events to outcome.
(2) Display a graphical record of the analytical process.
(3) Identify management system weaknesses and strengths."
[homer.ornl.gov/ sesa/ corporatesafety/ aip/ docs/ workbook/ Rev2/ chpt7/ chapt7.htm]
The FTA diagram example "Accident analytic tree" was created using the ConceptDraw PRO diagramming and vector drawing software extended with the Fault Tree Analysis Diagrams solution from the Engineering area of ConceptDraw Solution Park.
FTA diagram

Business diagrams & Org Charts with ConceptDraw DIAGRAM


HelpDesk
How to Create a Fault Tree Analysis Diagram (FTD)

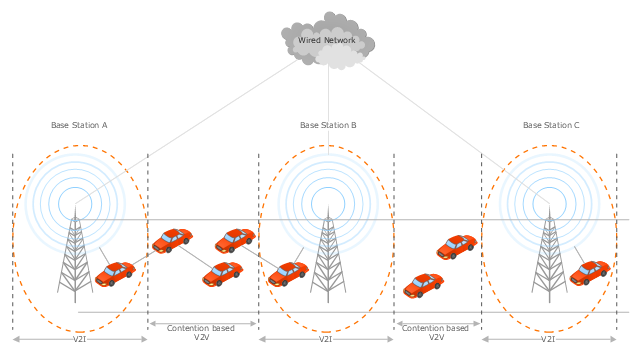
This vehicular network diagram sample was drawn on the base of the picture "Inter-Vehicle Communication (IVC) systems" from the website of the Department of Electrical and Computer Engineering, the Ohio State University.
[www2.ece.ohio-state.edu/ ~ekici/ res_ ivc.html]
"Driver assistance systems are meant to support drivers with driving process in order to avoid traffic accidents, speed up the traffic and have a higher control over the traffic in general. There are a lot of systems which give support to the drivers, such as adaptive cruise control, traffic sign recognition, automatic parking, etc. ... the vehicular communication systems ... use the capacity of the vehicles to communicate, not only between them but also with infrastructures. All the information is collected and processed to offer use
ful services. Wireless Sensor Networks (WSN) are widely used in this area. With the incoming upgrades of these networks, they are becoming an attractive solution to give support with the communication mechanisms between vehicles." [mi.fu-berlin.de/ inf/ groups/ ag-tech/ teaching/ 2011_ SS/ S_ 19510b_ Proseminar_ Technische_ Informatik/ daniel-lopez-report.pdf?1346662267]
The vehicular network diagram example "Inter-vehicle communication systems" was created using the ConceptDraw PRO diagramming and vector drawing software extended with the Vehicular Networking solution from the Computer and Networks area of ConceptDraw Solution Park.
Vehicular network diagram
This flowchart example was created on the base of land sales process diagram from the Property management webpage of the VicRoads website.
[www.vicroads.vic.gov.au/ planning-and-projects/ property-services/ property-management]
"VicRoads or the Roads Corporation of Victoria is a statutory corporation which is the state road and traffic authority in the state of Victoria, Australia. It is responsible for maintenance and construction of the state arterial road network, as well as driver licensing and vehicle registration. VicRoads has broad responsibility for road safety policy and research. It is also responsible for regulating the accident towing industry in Victoria." [VicRoads. Wikipedia]
"Sales Process.
Once it has been established with the relevant VicRoads Regions/ Projects and other business areas that properties are identified as surplus to VicRoads’ operational needs, they are incorporated in the VicRoads annual sales program.
Following approval: relevant VicRoads Regional Manager and the VicRoads Chief Executive (and in some circumstances Minster for Public Transport and Roads) must approve all land deemed surplus and available for disposal.
The method of sale is then determined and consultant advice is sought:
(1) Planning.
(2) Valuer General Victoria (Valuer General’s office must provide a valuation for all sales).
(3) Government Land Monitor (Land Monitor approval is sought if the value exceeds $750,000).
(4) Environmental.
(5) Local Council." [www.vicroads.vic.gov.au/ planning-and-projects/ property-services/ property-management]
The example "Land sales process flowchart" was created using the ConceptDraw PRO diagramming and vector drawing software extended with the Sales Flowcharts solution from the Marketing area of ConceptDraw Solution Park.
Sales process chart

The vector stencils library "Fault tree analysis diagrams" contains 12 symbols for drawing Fault Tree Analysis (FTA) diagrams.
"Fault tree analysis (FTA) is a top down, deductive failure analysis in which an undesired state of a system is analyzed using Boolean logic to combine a series of lower-level events. This analysis method is mainly used in the fields of safety engineering and reliability engineering to understand how systems can fail, to identify the best ways to reduce risk or to determine (or get a feeling for) event rates of a safety accident or a particular system level (functional) failure. FTA is used in the aerospace, nuclear power, chemical and process, pharmaceutical, petrochemical and other high-hazard industries; but is also used in fields as diverse as risk factor identification relating to social service system failure.
In aerospace, the more general term "system Failure Condition" is used for the "undesired state" / Top event of the fault tree. These conditions are classified by the severity of their effects. The most severe conditions require the most extensive fault tree analysis. These "system Failure Conditions" and their classification are often previously determined in the functional Hazard analysis." [Fault tree analysis. Wikipedia]
The shapes example "Fault tree analysis diagrams" was created using the ConceptDraw PRO diagramming and vector drawing software extended with the Fault Tree Analysis Diagrams solution from the Engineering area of ConceptDraw Solution Park.
FTA diagram symbols

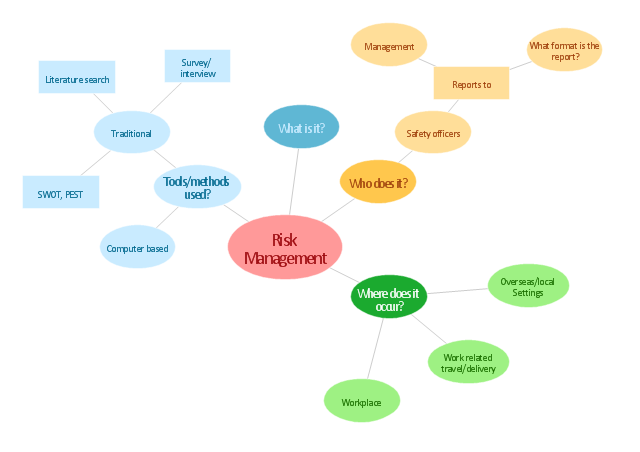
"Risk management is the identification, assessment, and prioritization of risks (defined in ISO 31000 as the effect of uncertainty on objectives, whether positive or negative) followed by coordinated and economical application of resources to minimize, monitor, and control the probability and/ or impact of unfortunate events or to maximize the realization of opportunities. Risks can come from uncertainty in financial markets, threats from project failures (at any phase in design, development, production, or sustainment life-cycles), legal liabilities, credit risk, accidents, natural causes and disasters as well as deliberate attack from an adversary, or events of uncertain or unpredictable root-cause. ... Methods, definitions and goals vary widely according to whether the risk management method is in the context of project management, security, engineering, industrial processes, financial portfolios, actuarial assessments, or public health and safety.
The strategies to manage threats (uncertainties with negative consequences) typically include transferring the threat to another party, avoiding the threat, reducing the negative effect or probability of the threat, or even accepting some or all of the potential or actual consequences of a particular threat, and the opposites for opportunities (uncertain future states with benefits)." [Risk management. Wikipedia]
The concept map example "Risk management" was created using the ConceptDraw PRO diagramming and vector drawing software extended with the Concept Maps solution from the area "What is a Diagram" of ConceptDraw Solution Park.
Concept map
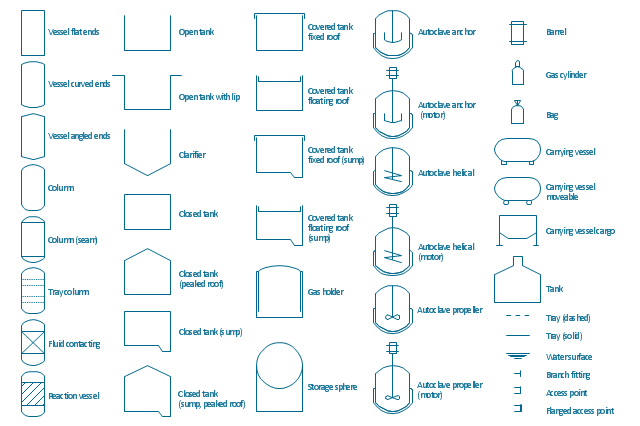
The vector stencils library "Vessels" contains 40 symbols of vessels, containers, tanks, drums, and basins.
Use these shapes for drawing process flow diagrams (PFD), materials handling systems, and feed systems in industrial and manufacturing processes.
"A pressure vessel is a closed container designed to hold gases or liquids at a pressure substantially different from the ambient pressure.
The pressure differential is dangerous and fatal accidents have occurred in the history of pressure vessel development and operation. Consequently, pressure vessel design, manufacture, and operation are regulated by engineering authorities backed by legislation. For these reasons, the definition of a pressure vessel varies from country to country, but involves parameters such as maximum safe operating pressure and temperature." [Pressure vessel. Wikipedia]
The example "Design elements - Vessels" was created using the ConceptDraw PRO diagramming and vector drawing software extended with the Chemical and Process Engineering solution from the Engineering area of ConceptDraw Solution Park.
Vessel symbols
The vector stencils library "Fire safety equipment" contains 19 clipart images of fire safety equipment which you can easy use in your presentations and illustrations.
"Fire safety refers to precautions that are taken to prevent or reduce the likelihood of a fire that may result in death, injury, or property damage, alert those in a structure to the presence of an uncontrolled fire in the event one occurs, better enable those threatened by fire to survive in and evacuate from affected areas, or to reduce the damage caused by a fire. Fire safety measures include those that are planned during the construction of a building or implemented in structures that are already standing, and those that are taught to occupants of the building.
Threats to fire safety are referred to as fire hazards. A fire hazard may include a situation that increases the likelihood a fire may start or may impede escape in the event a fire occurs." [Fire safety. Wikipedia]
The clip art example "Fire safety equipment - Vector stencils library" was created in the ConceptDraw PRO diagramming and vector drawing software using the Presentation Clipart solution from the Illustration area of ConceptDraw Solution Park.
www.conceptdraw.com/ solution-park/ illustrations-presentation-clipart
Figure

Fire door

Alarm CO detector

Bell

CO detector

Manual call point

Smoke detector 2

Fire Alarm Siren

Loudspeaker

Fire extinguisher
Fire alarm control panel

Fire bucket

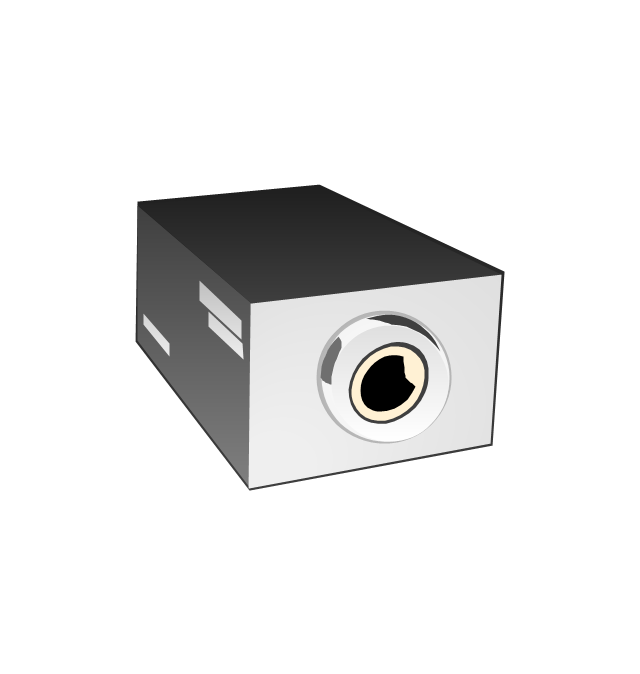
High-resolution CCD digital camera
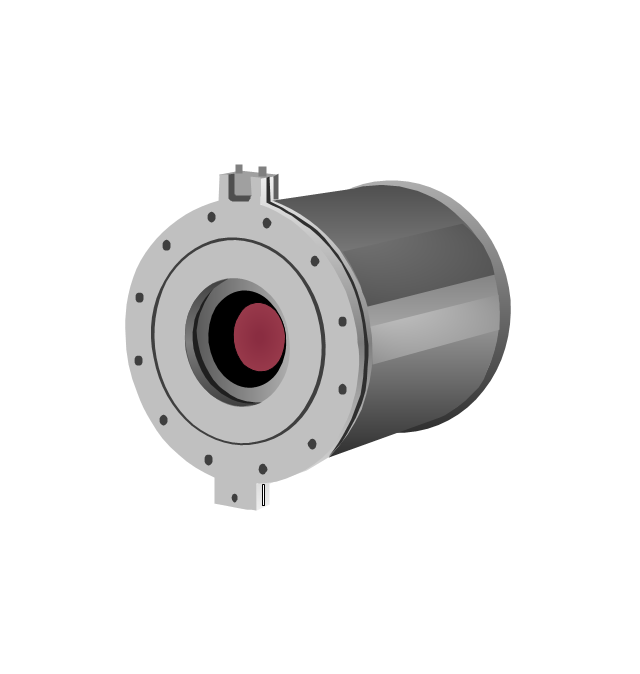
Infrared system for early fire detection

Infrared thermal imaging
Smoke detector

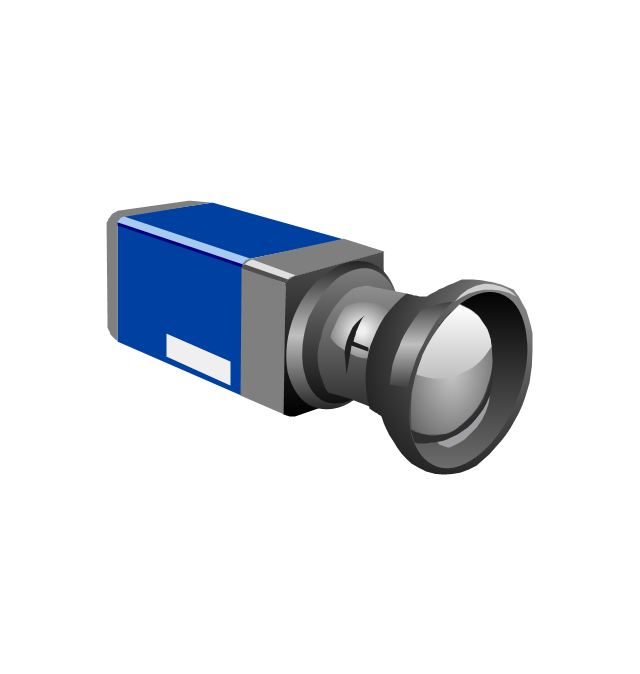
Security camera
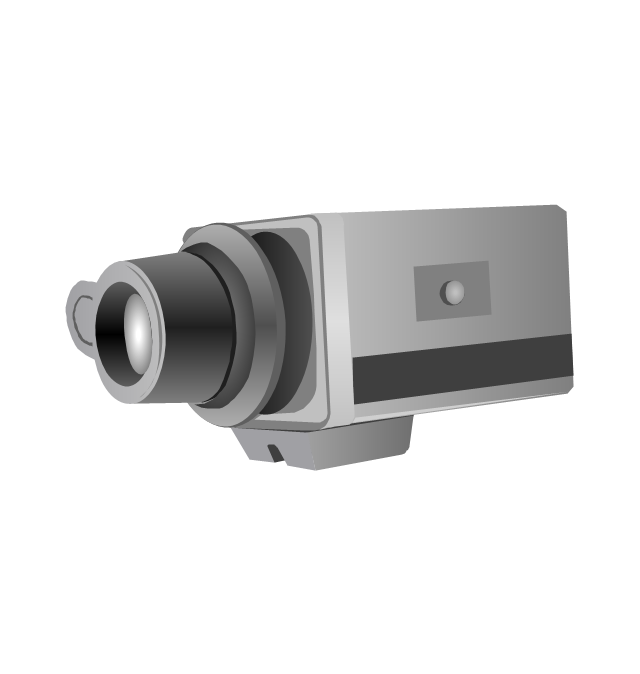
Thermographic process control system
Beacon
- FTA diagram - Hazard analysis | Accident analytic tree - FTA ...
- Solution Tree
- Example Of Accidents Using Fault Tree Analysis
- Accident analytic tree - FTA diagram | Fault Tree Analysis Diagrams ...
- Fault Tree Analysis Accident Investigation Example
- Trees Diagrams Example
- ConceptDraw Solution Park | How To Analyse The Accident
- Accident analytic tree - FTA diagram | Design elements - Fault tree ...
- Accident analytic tree - FTA diagram | Fault Tree Diagram | Fault ...
- Accident analytic tree - FTA diagram | Process Flowchart | Graphics ...
- Accident analytic tree - FTA diagram | SYSML | IDEF0 Diagrams ...
- Fault Tree Analysis Examples And Solutions
- Accident Map Software
- Draw Accident Free Download
- Root cause analysis tree diagram - Personal problem solution | Fault ...
- Feature Comparison Chart Software | SWOT Sample in Computers ...
- Diagram For Accident Report
- PROBLEM ANALYSIS. Root Cause Analysis Tree Diagram | Root ...
- Fault Tree Diagram Software
- CORRECTIVE ACTIONS PLANNING. Risk Diagram (PDPC) | How ...