This site uses cookies. By continuing to browse the ConceptDraw site you are agreeing to our Use of Site Cookies.

Example of DFD for Online Store (Data Flow Diagram)

Data flow diagrams (DFDs) reveal relationships among and between the various components in a program or system. DFDs are an important technique for modeling a system’s high-level detail by showing how input data is transformed to output results through a sequence of functional transformations.
Example of DFD for Online Store shows the Data Flow Diagram for online store and interactions between the Visitors, Customers and Sellers, as well as Website Information and User databases.
Steps to Creating a Sales Process Flow Chart

Entity Relationship Diagram Examples

Creating an entity-relationship (ER) model is to visually represent the structure of a business database, where data equates to entities (or objects) that are linked by defined relationships expressing dependencies and requirements. By nature it is an abstract visualization, the first step in the design process towards creating a logical and functional database.
ConceptDraw gives the ability to describe a database using the Entity-Relationship model. Entity-Relationship Diagram solution includes icons advocated by Chen's and Crow’s Foot notation that can be used when describing a database.
How to Build an Entity Relationship Diagram (ERD)

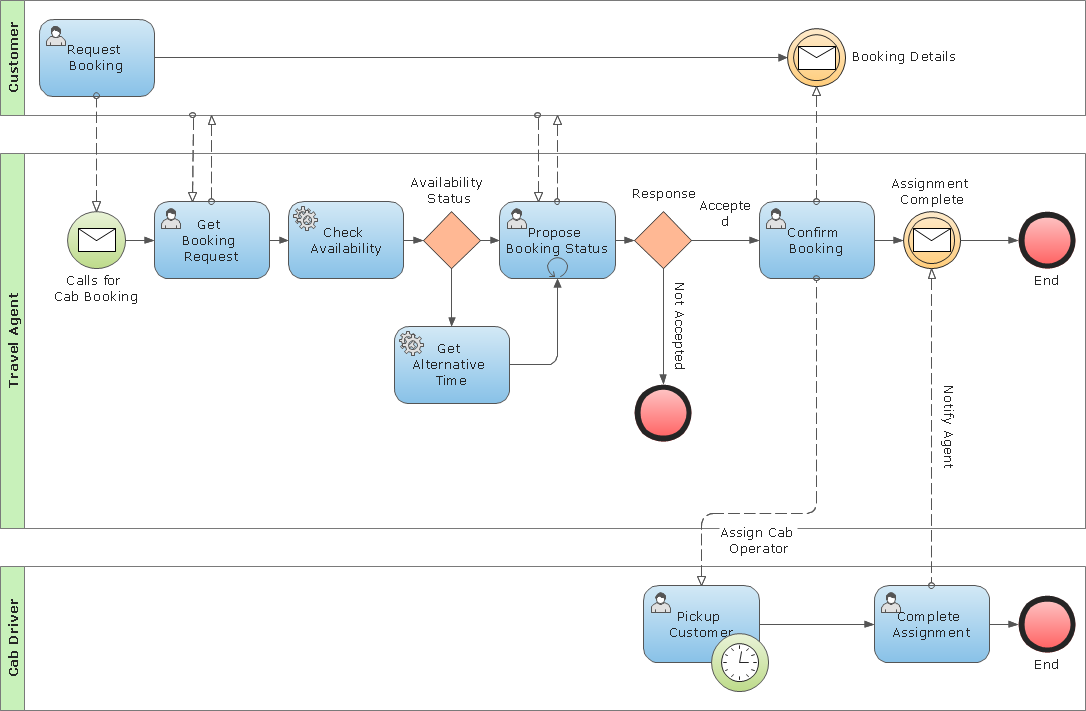
Business Process Modeling Notation Template

Create business process diagrams (BPMN 2.0.) with ConceptDraw using professional looking templates. ConceptDraw is business process improvement tools.

Flowchart Process Example

ConceptDraw DIAGRAM is a professional software for creating great looking flowcharts. The samples included in this set of software allows users to draw any type of flowchart.

What is the Accounting Cycle?

What is the accounting cycle? The accounting cycle is a sequence of steps that occur in the accounting period and include the processes of identifying, collecting, analyzing documents, recording transactions, classifying, summarizing, and reporting financial information of an organization.

UML Tool & UML Diagram Examples

The classical design of any automated process is UML diagrams that provide wide graphical ways to present all aspects of automation.
Solution RapidUML from Software Development area of ConceptDraw Solution Park provides templates, examples and 13 vector stencils libraries for drawing all types of UML 1.x and 2.x diagrams using ConceptDraw DIAGRAM diagramming and vector drawing software.
Use these UML diagram templates and examples to quickly start drawing your own UML diagrams.
HelpDesk

How to Edit Grouped Objects on Mac

ConceptDraw DIAGRAM offers a range of built-in facilities in order to enable you to quickly edit any diagram or other visualization made using ConceptDraw DIAGRAM, or MS Visio. Grouping shapes, pictures, or objects lets you style, format, rotate, and move them together, as though they were a single object.