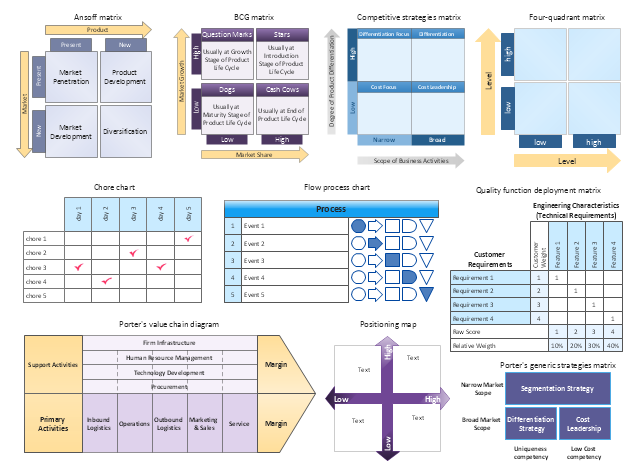
The vector stencils library Matrices contains 10 templates of marketing matrices and tables: chore chart, flow process chart, quality function deployment (QFD) chart, Ansoff matrix, BCG matrix, competitive strategies matrix, four-quadrant matrix, positioning map, Porter's value chain diagram, Porter's generic strategies matrix.
Use these templates to add marketing matrices and tables to your business documents, websites, presentation slides and infographics.
The example "Design elements - Matrices" was created using the ConceptDraw PRO diagramming and vector drawing software extended with the Matrices solution from the Marketing area of ConceptDraw Solution Park.
Marketing matrices
 Event-driven Process Chain Diagrams
Event-driven Process Chain (EPC) Diagram is a type of flowchart widely used for modeling in business engineering and reengineering, business process improvement, and analysis. EPC method was developed within the Architecture of Integrated Information Systems (ARIS) framework.
Software for Drawing EPC Diagrams
")
Basic Flowchart Symbols and Meaning


Formalization and Verification of Event-driven Process chain

 Marketing Diagrams
Marketing Diagrams solution extends ConceptDraw PRO diagramming software with abundance of samples, templates and vector design elements intended for easy graphical visualization and drawing different types of Marketing diagrams and graphs, including Branding Strategies Diagram, Five Forces Model Diagram, Decision Tree Diagram, Puzzle Diagram, Step Diagram, Process Chart, Strategy Map, Funnel Diagram, Value Chain Diagram, Ladder of Customer Loyalty Diagram, Leaky Bucket Diagram, Promotional Mix Diagram, Service-Goods Continuum Diagram, Six Markets Model Diagram, Sources of Customer Satisfaction Diagram, etc. Analyze effectively the marketing activity of your company and apply the optimal marketing methods with ConceptDraw PRO software.
 Business Package for Management
Package intended for professional who designing and documenting business processes, preparing business reports, plan projects and manage projects, manage organizational changes, prepare operational instructions, supervising specific department of an organization, workout customer service processes and prepare trainings for customer service personal, carry out a variety of duties to organize business workflow.
Types of Flowcharts


Identifying Quality Management System

Daisy Chain Network Topology

- Elements Of Prosess Quality Chain
- Elements Of Process Quality Chain
- Identify The Elements Of A Process Quality Chain
- Identify Elements Of A Process Quality Chain
- Event-driven Process Chain Diagrams | Total Quality Management ...
- Elements Of A Process Quality Chain
- Quality Chain Diagram
- Diagram Of Quality Chain
- Process Quality Chain
- Process Quality Chain Elements