"Ecosystems represent sources of natural capital and provide goods and services to society, also called ecosystem services. The Millennium Ecosystem Assessment identified over 24 ecosystem services that can be divided up into 4 general groups including: 1) provisioning, 2) supporting, 3) regulating and 4) cultural." [User:Sawtoothgirl/ Sustainable Real Estate Development. Wikipedia]
"Humankind benefits in a multitude of ways from ecosystems. Collectively, these benefits are known as ecosystem services. Ecosystem services are regularly involved in the provisioning of clean drinking water and the decomposition of wastes. While scientists and environmentalists have discussed ecosystem services implicitly for decades, these the ecosystem services concept itself was popularized by the Millennium Ecosystem Assessment (MA) in the early 2000s. This grouped ecosystem services into four broad categories: provisioning, such as the production of food and water; regulating, such as the control of climate and disease; supporting, such as nutrient cycles and crop pollination; and cultural, such as spiritual and recreational benefits. To help inform decision-makers, many ecosystem services are being assigned economic values." [Ecosystem services. Wikipedia]
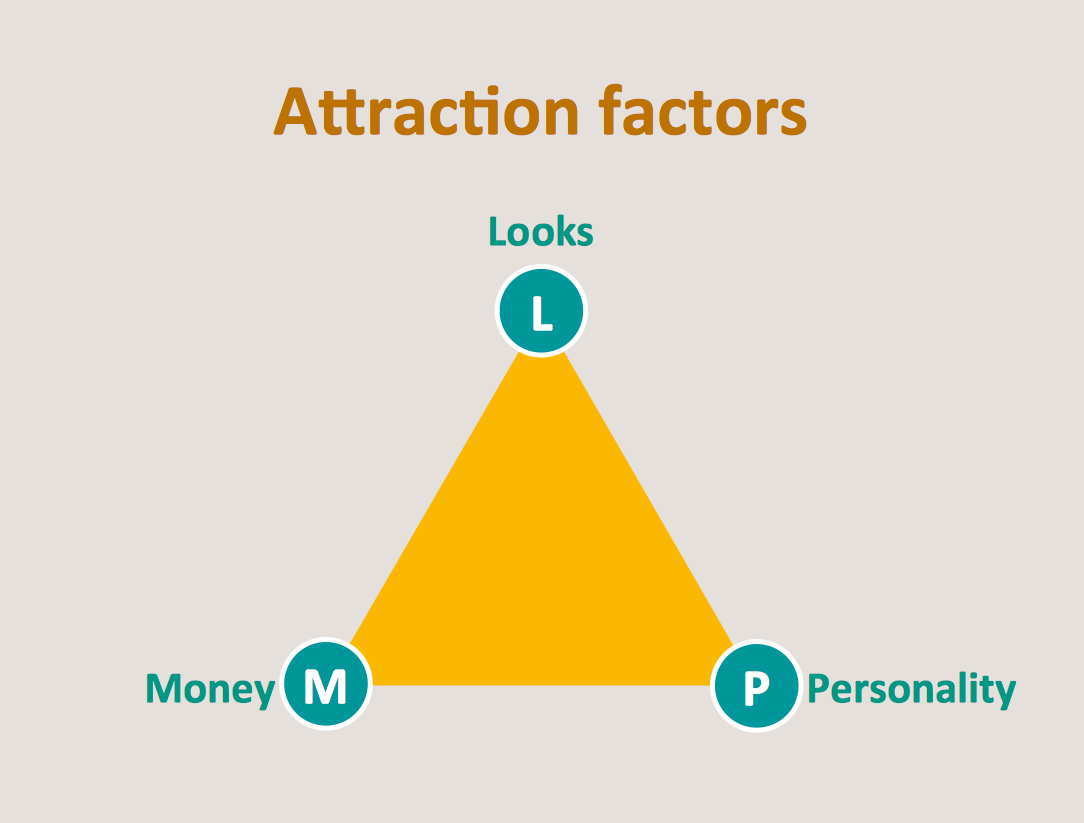
The segmented pyramid diagram example "Ecosystem goods and services" was redesigned using the ConceptDraw PRO diagramming and vector drawing software from Wikimedia Commons file ES_ triangle.png.
[commons.wikimedia.org/ wiki/ File:ES_ triangle.png]
This file is licensed under the Creative Commons Attribution-Share Alike 3.0 Unported license. [creativecommons.org/ licenses/ by-sa/ 3.0/ deed.en]
This segmented pyramid diagram example "Ecosystem goods and services" is included in the Pyramid Diagrams solution from the Marketing area of ConceptDraw Solution Park.
"Humankind benefits in a multitude of ways from ecosystems. Collectively, these benefits are known as ecosystem services. Ecosystem services are regularly involved in the provisioning of clean drinking water and the decomposition of wastes. While scientists and environmentalists have discussed ecosystem services implicitly for decades, these the ecosystem services concept itself was popularized by the Millennium Ecosystem Assessment (MA) in the early 2000s. This grouped ecosystem services into four broad categories: provisioning, such as the production of food and water; regulating, such as the control of climate and disease; supporting, such as nutrient cycles and crop pollination; and cultural, such as spiritual and recreational benefits. To help inform decision-makers, many ecosystem services are being assigned economic values." [Ecosystem services. Wikipedia]
The segmented pyramid diagram example "Ecosystem goods and services" was redesigned using the ConceptDraw PRO diagramming and vector drawing software from Wikimedia Commons file ES_ triangle.png.
[commons.wikimedia.org/ wiki/ File:ES_ triangle.png]
This file is licensed under the Creative Commons Attribution-Share Alike 3.0 Unported license. [creativecommons.org/ licenses/ by-sa/ 3.0/ deed.en]
This segmented pyramid diagram example "Ecosystem goods and services" is included in the Pyramid Diagrams solution from the Marketing area of ConceptDraw Solution Park.
Pyramid diagram

This wheel diagram sample was created on the base of figure illustrating the webpage "Chapter 3: Current State of the Ecosystem" of the website of the National Broadband Plan of US Federal Communications Comission (FCC). "The broadband ecosystem includes applications and content: e-mail, search, news, maps, sales and marketing applications used by businesses, user-generated video and hundreds of thousands of more specialized uses. Ultimately, the value of broadband is realized when it delivers useful applications and content to end-users.
Applications run on devices that attach to the network and allow users to communicate: computers, smartphones, set-top boxes, e-book readers, sensors, private branch exchanges (PBX), local area network routers, modems and an ever-growing list of other devices. New devices mean new opportunities for applications and content.
Finally, broadband networks can take multiple forms: wired or wireless, fixed or mobile, terrestrial or satellite. Different types of networks have different capabilities, benefits and costs.
The value of being connected to the network increases as more people and businesses choose to adopt broadband and use applications and devices that the network supports. Several factors contribute to their decisions. These include whether they can afford a connection, whether they are comfortable with digital technology and whether they believe broadband is useful.
Networks, devices and applications drive each other in a virtuous cycle. If networks are fast, reliable and widely available, companies produce more powerful, more capable devices to connect to those networks. These devices, in turn, encourage innovators and entrepreneurs to develop exciting applications and content. These new applications draw interest among end-users, bring new users online and increase use among those who already subscribe to broadband services. This growth in the broadband ecosystem reinforces the cycle, encouraging service providers to boost the speed, functionality and reach of their networks."
[broadband.gov/ plan/ 3-current-state-of-the-ecosystem/ ]
The circle pie chart example "Forces shaping the broadband ecosystem in the US" was created using the ConceptDraw PRO diagramming and vector drawing software extended with the Target and Circular Diagrams solution from the Marketing area of ConceptDraw Solution Park.
www.conceptdraw.com/ solution-park/ marketing-target-and-circular-diagrams
Wheel diagram

Energy Pyramid Diagram

Diagram of a Pyramid
Geo Map — USA — Oklahoma

The vector stencils library "Geography" contains 14 clipart images of natural landscapes and water features for drawing illustrations.
"A natural landscape is a landscape that is unaffected by human activity. A natural landscape is intact when all living and nonliving elements are free to move and change. The nonliving elements distinguish a natural landscape from a wilderness. A wilderness includes areas within which natural processes operate without human interference, but a wilderness must contain life. As implied, a natural landscape may contain either the living or nonliving or both." [Natural landscape. Wikipedia]
The clip art example "Geography - Vector stencils library" was created using the ConceptDraw PRO diagramming and vector drawing software extended with the Nature solution from the Illustration area of ConceptDraw Solution Park.
www.conceptdraw.com/ solution-park/ illustrations-nature
Ocean

Forest
River

Lake
Waterfall

Mountains

Mountain

Ravine

Volcano
Desert

Hills

Iceberg

Conifer tree

Tree

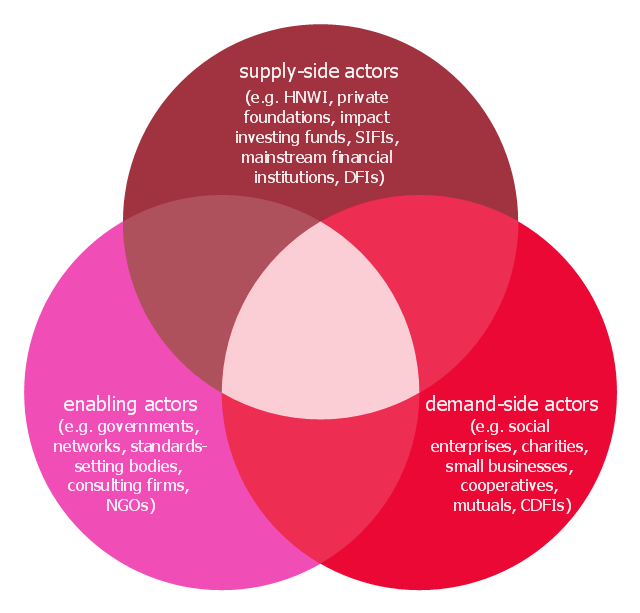
This Venn diagram sample shows the interaction between supply-side, demand-side and enabling actors. It was designed on the base of the Venn diagram in the policy paper "Social Impact Investment Forum: outputs and actions" from the UK Government website.
"Collaboration and market champions.
Social impact investment brings together a diverse group of actors with different goals, expectations and ways of working. A key message from the Forum was that, while roles may overlap, actors must play to their strengths to encourage market growth.
For supply-side actors, this meant investing money and resources in social ventures in a way that would meets investors’ capital and risk profile and would be appropriate to the development stage of the social venture. For demand-side actors, it meant finding new models to deliver impact and new markets for social ventures. Finally, for enabling actors it meant taking action to help build the market ecosystem." [gov.uk/ government/ publications/ social-impact-investment-forum-outputs-and-actions/ social-impact-investment-forum-outputs-and-actions]
Contains public sector information licensed under the Open Government Licence v3.0. [nationalarchives.gov.uk/ doc/ open-government-licence/ version/ 3/ ]
The diagram example "Interaction between market actors" was created using the ConceptDraw PRO diagramming and vector drawing software extended with the Venn Diagrams solution from the area "What is a Diagram" of ConceptDraw Solution Park.
Venn diagram
 Target and Circular Diagrams
This solution extends ConceptDraw DIAGRAM software with samples, templates and library of design elements for drawing the Target and Circular Diagrams.
 Pyramid Diagrams
Pyramid Diagrams solution extends ConceptDraw DIAGRAM software with templates, samples and library of vector stencils for drawing the marketing pyramid diagrams.
Flowchart Components

- Ecosystem goods and services - Segmented pyramid diagram ...
- France exports of goods and services | Ecosystem goods and ...
- Citric acid cycle (TCA cycle) | Ecosystem goods and services ...
- Ecosystem goods and services - Segmented pyramid diagram | Pie ...
- Energy Pyramid Diagram | Diagram of a Pyramid | Ecosystem Map ...
- Ecosystem goods and services - Segmented pyramid diagram
- Ecosystem Pyramid Chart
- Service-goods continuum diagram | France exports of goods and ...
- Wireless broadband network diagram | Forces shaping the ...
- How to Draw a Pyramid Diagram in ConceptDraw PRO | Pyramid ...