Onion Diagram Maker
The onion diagram is a type of diagram which shows the dependencies among parts of an organization or process. The items are displayed at the concentric circles, where the items at the bigger rings depend on the items at the smaller rings. ConceptDraw DIAGRAM diagramming and vector drawing software extended with Stakeholder Onion Diagrams Solution from the Management Area of ConceptDraw Solution Park is a professional Onion Diagram Maker.Active Directory Diagram
Active Directory (AD) is a directory management service introduced by Microsoft Corporation for Windows domain networks. This service uses the Lightweight Directory Access Protocol (LDAP) and provides quick access to the included information about large structural units such as domains, organizational units, sites, and also about simple objects, such as users names with detailed information about them - contacts information, access rights, etc. Active Directory Diagram is a representation of the network structure in clear graphical format. It is a scheme of correlations of service components with preset degree of detailed elaboration. Active Directory Diagram makes the work of network administrators with Active Directory network structure more easy and convenient, allows plan and service the network quicker and more qualitatively. The help of ConceptDraw DIAGRAM software extended with Active Directory Diagrams solution from the Computer and Networks area is indispensable for easily and quickly creation the highly detailed Active Directory Diagrams.How To Create CCTV Network Diagram
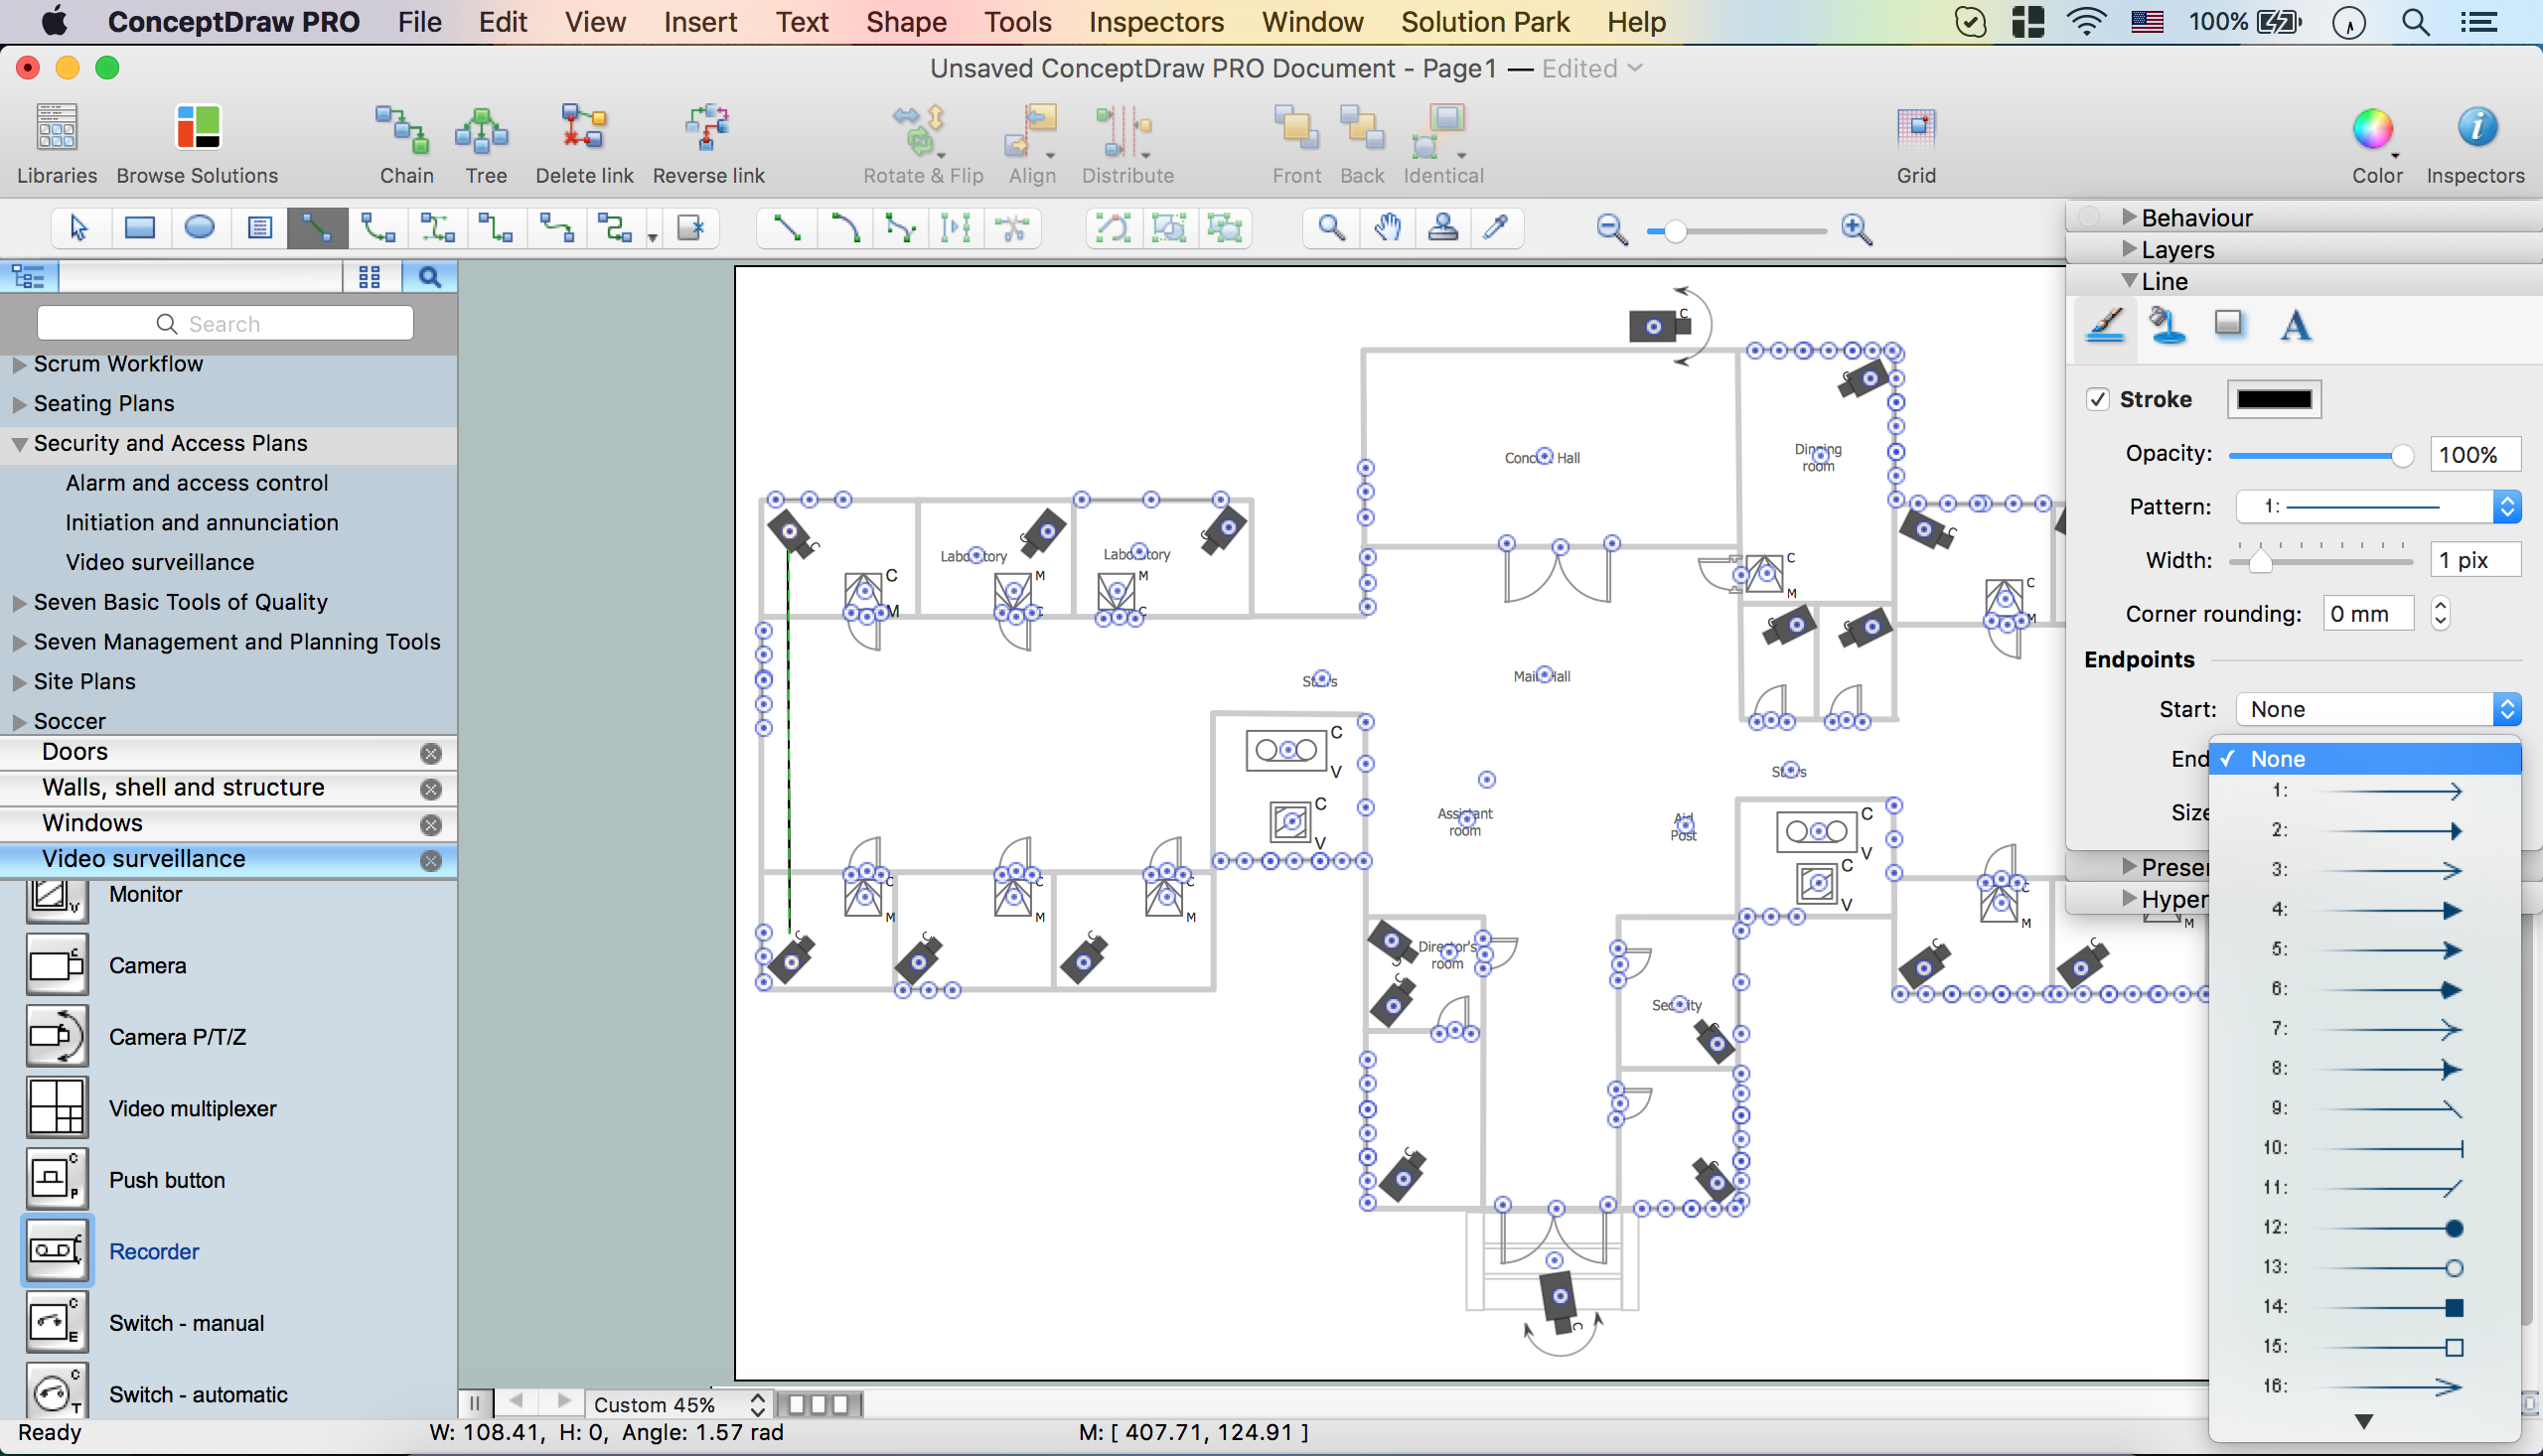
Closed-circuit television (CCTV) uses cameras and monitors to carry out video surveillance. Unlike broadcast television this system has only local signal. It is a feature of almost every video camera, yet CCTV is mainly a system for visual control of certain areas such as banks, airports, supermarkets, and other places for security reasons. Developing and installing CCTV system is a time-consuming process. It also requires certain knowledge and skills. ConceptDraw is a solution of setting video cameras rationally. You can achieve two aims at once: CCTV Design Tool saves your time and your money and helps you make professional video surveillance system.Functional Flow Block Diagram
You need to draw a Functional Flow Block Diagram? You are an artist? Now it doesn't matter. With Block Diagrams solution from the "Diagrams" area for ConceptDraw Solution Park you don't need more to be an artist to design the Functional Flow Block Diagram of any complexity.Bubble Charts
Bubble Charts are convenient way to visualize ideas and concepts by organizing them in a hierarchy. To show the importance of ideas you can use different bubble sizes and colors. ConceptDraw DIAGRAM diagramming and vector drawing software extended with Bubble Diagrams Solution from the "Diagrams" Area affords you the easiest and fastest way for designing professional looking Bubble Charts.- Flowchart Software Free Download | Process Flowchart | Basic ...
- Form Maker | Landscape Architecture with ConceptDraw PRO ...
- ConceptDraw Software Full Versions Free Download | Flowchart ...
- Block Diagrams | Form Free
- | Flowchart Software Free Download | Flow Chart Maker Free
- Sign Making Software | Flowchart Software | Flowchart Software | Ad ...
- The Circular Flow Diagram
- Flowchart Software Free Download
- Basic Diagramming | Block Diagram Creator | Block Diagram | Block ...
- Bubble Chart Maker | Bubble Diagrams | Bubble Chart | Free Blank ...
- Bubble Charts | How To Create a Bubble Chart | Bubble Map Maker ...
- Block Diagram Creator | Electrical Drawing Software and Electrical ...
- Circle Diagrams | Circular Diagram | Best Diagramming | Circle ...
- Process flow - Credit approval | Cross-Functional Flowchart - The ...
- Bubble Chart Maker | Flow Diagram Software | Bubble Diagrams ...
- Branch Diagram Maker
- Cross-Functional Flowchart - The easiest way to draw ...
- Draw Cycle Of Data Conversion In Simple Form
- Block Flow Diagram | Block Diagrams | Block Diagram Creator ...
- Process Flowchart | Types of Flowchart - Overview | Flow Chart ...


