Process Flowchart
The main reason of using Process Flowchart or PFD is to show relations between major parts of the system. Process Flowcharts are used in process engineering and chemical industry where there is a requirement of depicting relationships between major components only and not include minor parts. Process Flowcharts for single unit or multiple units differ in their structure and implementation. ConceptDraw PRO is Professional business process mapping software for making Process flowcharts, Process flow diagram, Workflow diagram, flowcharts and technical illustrations for business documents and also comprehensive visio for mac application. Easier define and document basic work and data flows, financial, production and quality management processes to increase efficiency of your business with ConcepDraw PRO. Business process mapping software with Flowchart Maker ConceptDraw PRO includes extensive drawing tools, rich examples and templates, process flowchart symbols and shape libraries, smart connectors that allow you create the flowcharts of complex processes, process flow diagrams, procedures and information exchange. Process Flowchart Solution is project management workflow tools which is part ConceptDraw Project marketing project management software. Drawing charts, diagrams, and network layouts has long been the monopoly of Microsoft Visio, making Mac users to struggle when needing such visio alternative like visio for mac, it requires only to view features, make a minor edit to, or print a diagram or chart. Thankfully to MS Visio alternative like ConceptDraw PRO software, this is cross-platform charting and business process management tool, now visio alternative for making sort of visio diagram is not a problem anymore however many people still name it business process visio tools.
HelpDesk
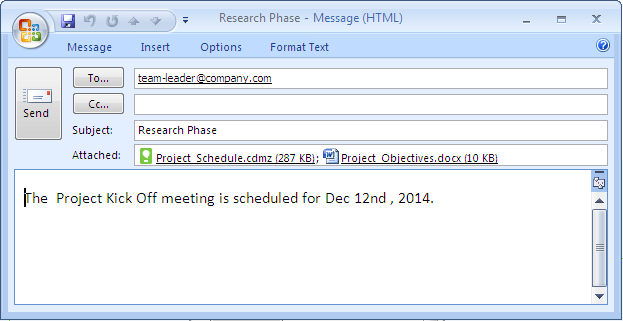
How to Send an Outlook Email From a Mind Map
ConceptDraw MINDMAP v8 supports integration with MS Outlook. The mind map topic can be transformed into MS Outlook message with one click.HelpDesk
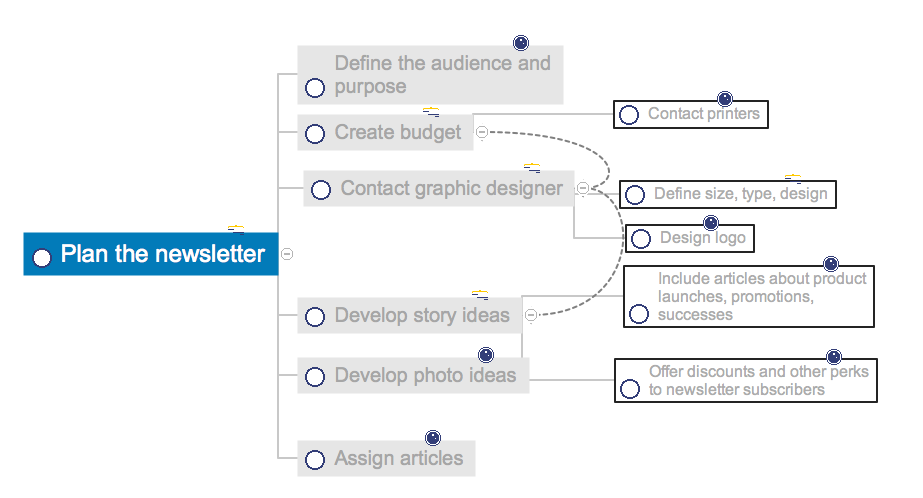
How to Change the Form and Color of a Topic’s Line in Your Mind Map
You can completely customize the style of your mind maps, including the style of topic lines and outlines. This article describes how to change the form and color of a topic’s line in your mind map.How to draw Metro Map style infographics? (New York)
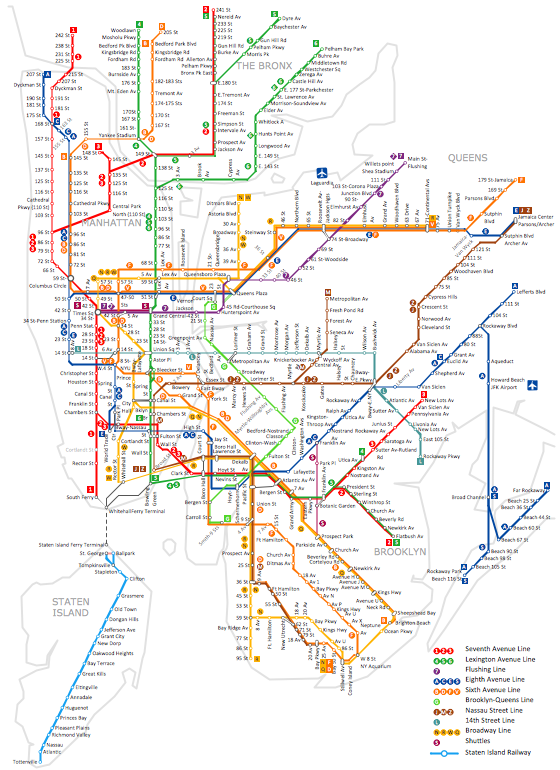
How to draw Metro Map style infographics of New York subway. New York Subway has a long history starting on October 27, 1904. Since the opening many agencies have provided schemes of the subway system. At present time are 34 lines in use. This page present New York City subway map construct with Metro Map Solution in Conceptdraw PRO software. This is a one-click tool to add stations to the map. It lets you control the direction in which you create new stations, change lengths, and add text labels and icons. It contains Lines, Stations, and Landmarks objectsHelpDesk
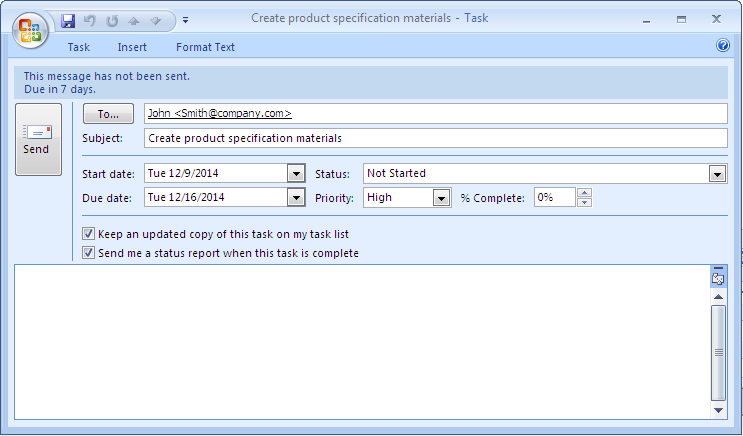
How to Send Task From a Mind Map to MS Outlook
ConceptDraw MINDMAP v8 supports integration with MS Outlook. The mind map topic can be transformed into MS Outlook message.Sample Pictorial Chart. Sample Infographics
Sample Pictorial Chart - Pictorial Infographics solution provides easy-to-use design infographics drawing tools, large collection of different sample infographics and infograms, sample pictorial chart and templates to be filled in, and 10 libraries with great quantity of predesigned vector pictograms. Use Pictorial Infographics solution to draw your own design pictorial infographics documents quick and easy.HelpDesk
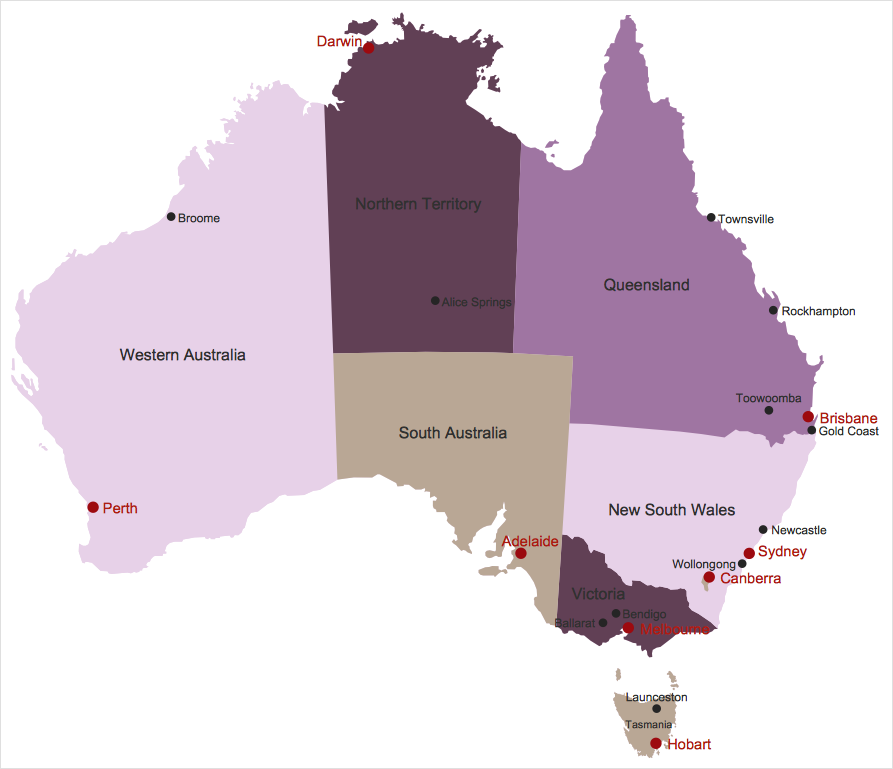
How to Draw Maps of Australia
Australia is the sixth largest country in the world. Australia consists from the mainland which is surrounded by many thousands of small fringing islands and numerous larger ones. The vast territories, aligned with interesting historic features across a wide expanse, make the thematic map an ideal way of depicting geographical, geological and political information related to Australia.The Australia Map solution for ConceptDraw PRO will help you to make the steps of the creativeness easy and intuitive. The Australia Map solution provides templates and samples along with vector stencils to get you started. Used together with other ConceptDraw PRO solutions it will allow you to create comprehensive geography-related infographics.Form Maker
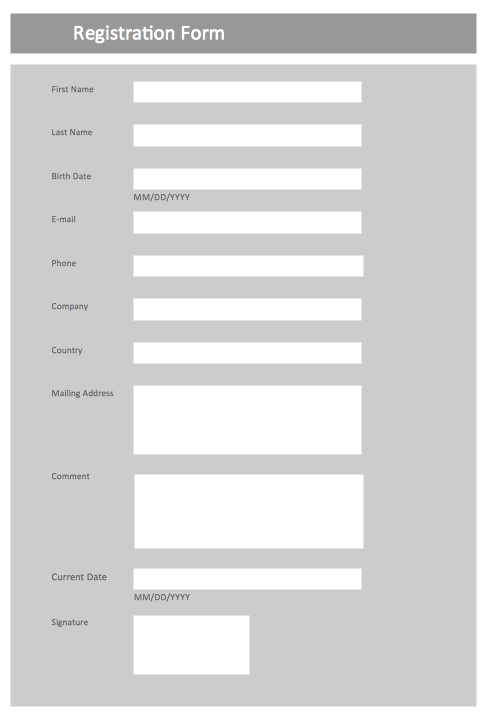
Use the Basic Diagramming Solution from the Universal Diagramming area of ConceptDraw Solution Park to easy create simple forms, questionnaires, survey forms, registration and application forms, etc.HelpDesk
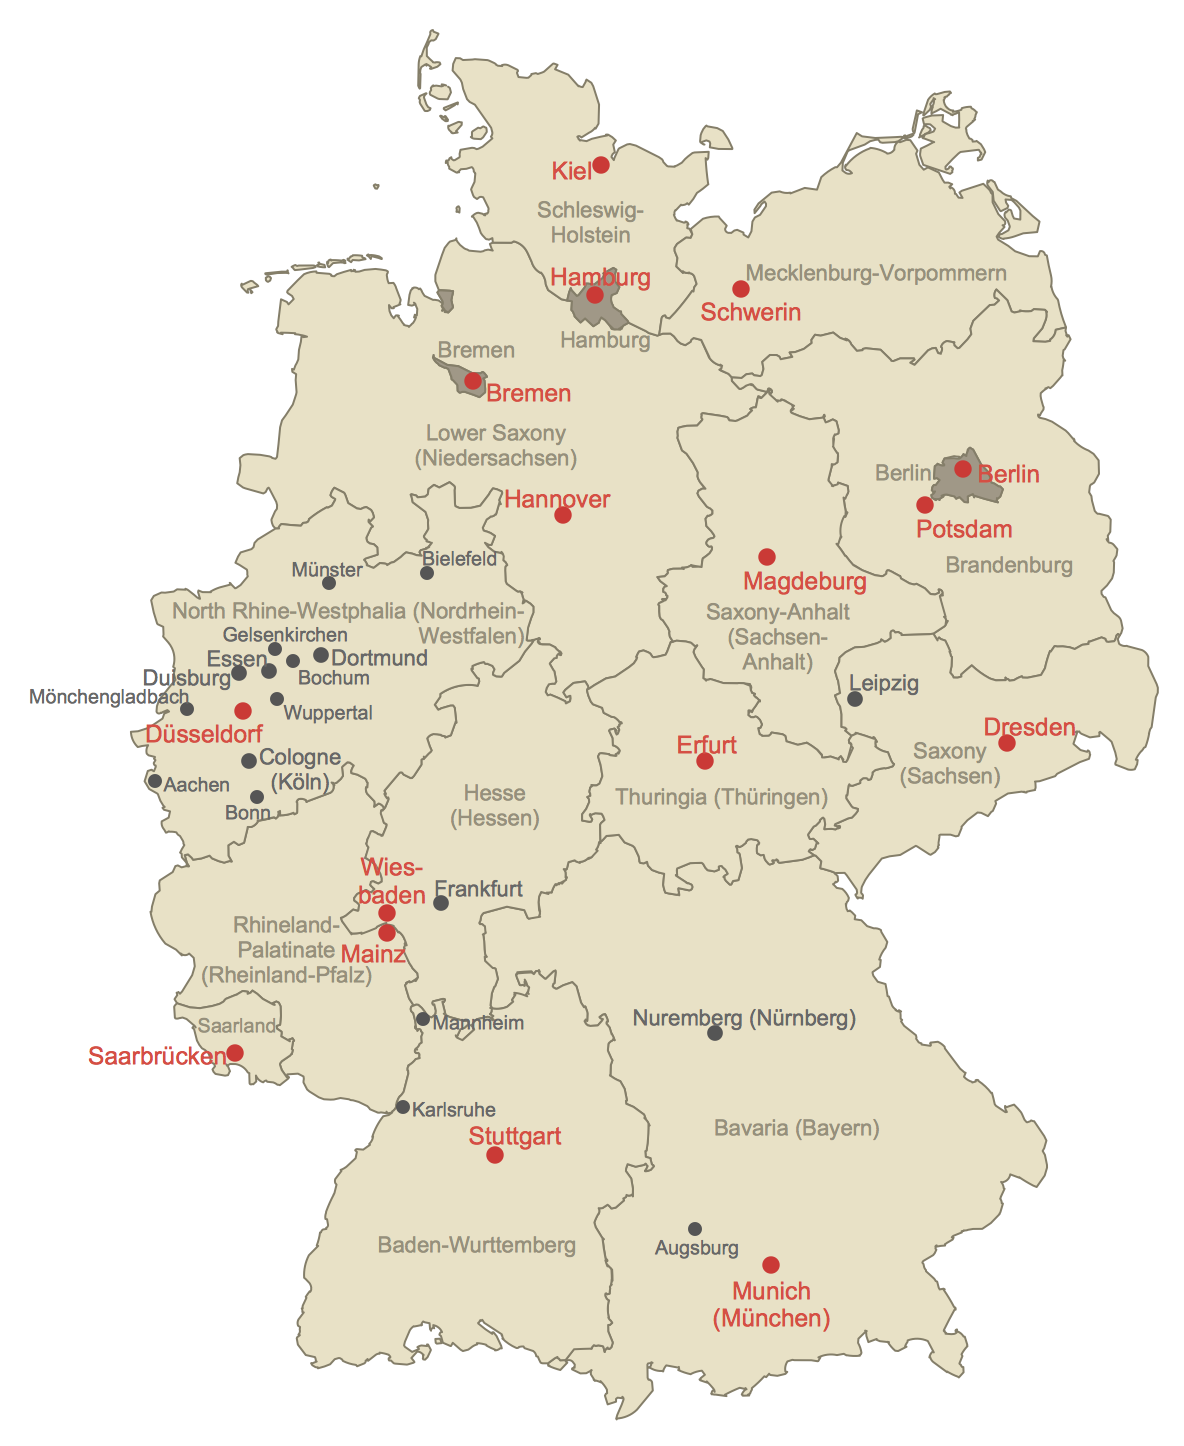
How to Create a Map of Germany Using ConceptDraw PRO
Geographical thematic maps are used to display information on a variety of subjects. It is a common way of representing any form of spatial data in relation to a specific geographical area. The Germany Map Solution for ConceptDraw PRO includes all of the German federal states with county outlined borders and major cities. You can quickly create geographic maps, cartograms, and thematic maps for geographical visualization information for business and travels.Entity Relationship Diagram Symbols
The semantic modeling method nowadays is successfully applied in database structure design. It is effective method of modeling the data structures, which is based on the meaning of these data. As a tool of semantic modeling, there are used different types of Entity-Relationship Diagrams. Entity Relationship Diagram (ERD) is applied to visually and clearly represent a structure of a business database. The main components of ERDs are: entity, relation and attributes. An entity is a class of similar objects in the model, each entity is depicted in the form of rectangle and has the name expressed by a noun. Relation is shown in the form of non-directional line that connects two entities. There are several notation styles used for ERDs: information engineering style, Chen style, Bachman style, Martin Style. The Entity Relationship Diagram symbols used for professional ERD drawing are predesigned by professionals and collected in the libraries of the Entity-Relationship Diagram (ERD) solution for ConceptDraw PRO software.- Draw A Circle Of Data Conversion In A Simple Form
- How to Insert a Mind Map into Microsoft Word Document | Concept ...
- Personnel Form Templates
- Mind Map Line
- Geo Map - Asia - Turkmenistan | 7 Continents Map | North Direction ...
- Draw Cycle Of Data Conversion In Simple Form
- Drawing Of Concept Map
- How to Set Line Jumps for Smart Connectors in ConceptDraw PRO ...
- How to Draw a Mind Map on Mac | How to Install ConceptDraw on a ...
- Draw The Tricarboxylic Acid Cycle

