Entity Relationship Diagram Symbols

ERD Symbols and Meanings


Entity Relationship Diagram - ERD - Software for Design Crows Foot ER Diagrams
_Win_Mac.png)
This example was designed on the base of the Wikimedia Commons file: Weak entity ER-example.svg.
[commons.wikimedia.org/ wiki/ File:Weak_ entity_ ER-example.svg]
This file is licensed under the Creative Commons Attribution-Share Alike 3.0 Unported license. [creativecommons.org/ licenses/ by-sa/ 3.0/ deed.en]
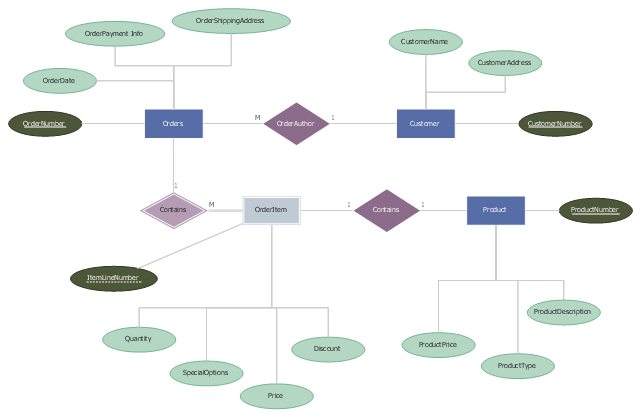
"In a relational database, a weak entity is an entity that cannot be uniquely identified by its attributes alone; therefore, it must use a foreign key in conjunction with its attributes to create a primary key. The foreign key is typically a primary key of an entity it is related to.
In entity relationship diagrams, ER diagrams a weak entity set is indicated by a bold (or double-lined) rectangle (the entity) connected by a bold (or double-lined) type arrow to a bold (or double-lined) diamond (the relationship)." [Weak entity. Wikipedia]
The entity-relationship diagram example "Weak entity ERD" was drawn using ConceptDraw PRO software extended with the Entity-Relationship Diagram (ERD) solution from the Software Development area of ConceptDraw Solution Park.
[commons.wikimedia.org/ wiki/ File:Weak_ entity_ ER-example.svg]
This file is licensed under the Creative Commons Attribution-Share Alike 3.0 Unported license. [creativecommons.org/ licenses/ by-sa/ 3.0/ deed.en]
"In a relational database, a weak entity is an entity that cannot be uniquely identified by its attributes alone; therefore, it must use a foreign key in conjunction with its attributes to create a primary key. The foreign key is typically a primary key of an entity it is related to.
In entity relationship diagrams, ER diagrams a weak entity set is indicated by a bold (or double-lined) rectangle (the entity) connected by a bold (or double-lined) type arrow to a bold (or double-lined) diamond (the relationship)." [Weak entity. Wikipedia]
The entity-relationship diagram example "Weak entity ERD" was drawn using ConceptDraw PRO software extended with the Entity-Relationship Diagram (ERD) solution from the Software Development area of ConceptDraw Solution Park.
Entity-relationship diagram
HelpDesk
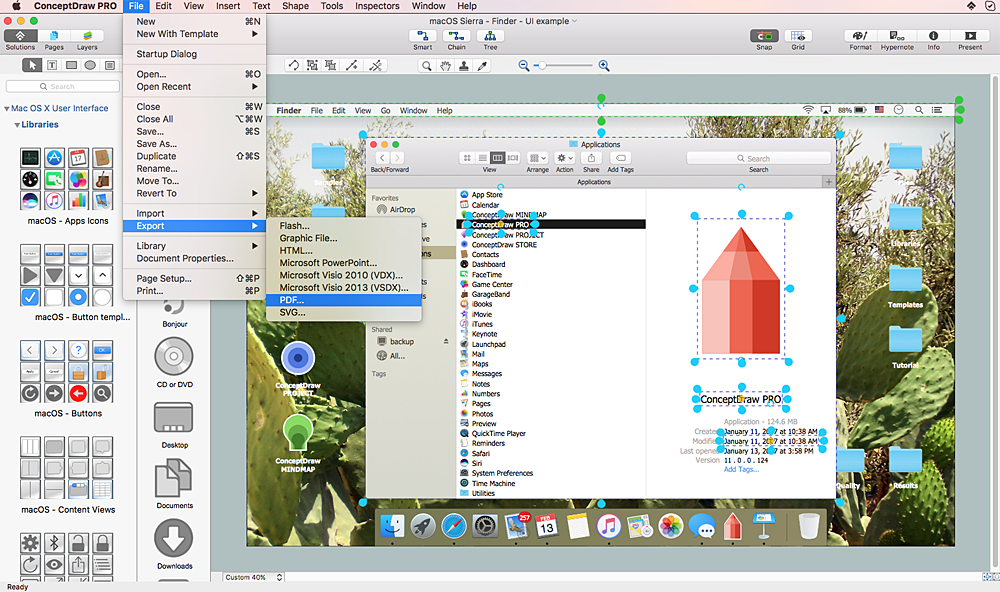
How to Design a Mockup of Apple macOS Sierra GUI
ERD Symbols and Meanings
"Chen's notation for entity–relationship modeling uses rectangles to represent entity sets, and diamonds to represent relationships appropriate for first-class objects: they can have attributes and relationships of their own. If an entity set participates in a relationship set, they are connected with a line.
Attributes are drawn as ovals and are connected with a line to exactly one entity or relationship set.
Cardinality constraints are expressed as follows:
- a double line indicates a participation constraint, totality or surjectivity: all entities in the entity set must participate in at least one relationship in the relationship set;
- an arrow from entity set to relationship set indicates a key constraint, i.e. injectivity: each entity of the entity set can participate in at most one relationship in the relationship set;
- a thick line indicates both, i.e. bijectivity: each entity in the entity set is involved in exactly one relationship.
- an underlined name of an attribute indicates that it is a key: two different entities or relationships with this attribute always have different values for this attribute.
Attributes are often omitted as they can clutter up a diagram; other diagram techniques often list entity attributes within the rectangles drawn for entity sets." [Entity–relationship model. Wikipedia]
The vector stencils library ERD, Chen's notation contains 13 symbols for drawing entity-relatinship diagrams using the ConceptDraw PRO diagramming and vector drawing software.
The example "Design elements - ER diagram (Chen notation)" is included in the Entity-Relationship Diagram (ERD) solution from the Software Development area of ConceptDraw Solution Park.
Chen's ERD
.png--diagram-flowchart-example.png)
Notation & Symbols for ERD

Entity-Relationship Diagram (ERD) with ConceptDraw DIAGRAM

HelpDesk
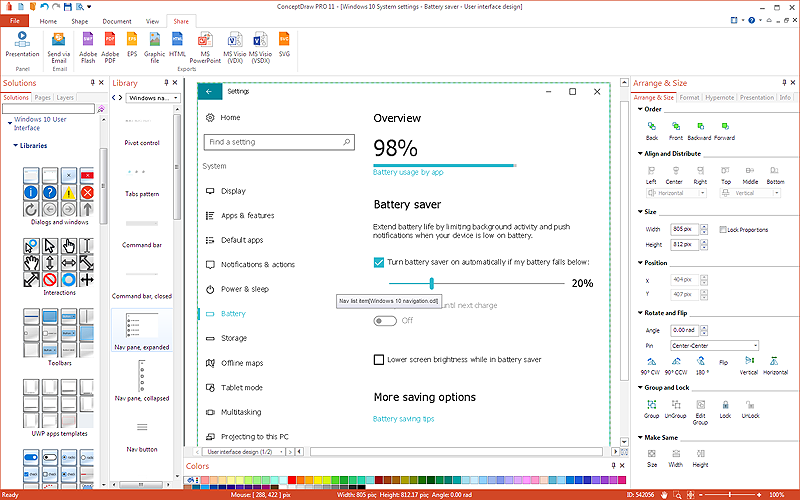
How to Design a Mockup of Windows 10 User Interface
- Entity Relationship Diagram Symbols | ERD Symbols and Meanings ...
- What Does Double Line Indicate In Er Diagram
- Double Diamond In Er Diagram
- Double Rectangle In Er Diagram
- Design elements - ER diagram (Chen notation) | Eer Diagram ...
- What Does It Meaning Of Double Line Relationship In Er Diagram
- Circle Png Background
- Bar Chart Software | Column Chart Software | Bar Graphs | Double ...
- Vector Graphic Diagram
- Entity Relationship Diagram - ERD - Software for Design Crows Foot ...