This arrow ring chart sample was created on the base of the figure illustrating the webpage "National Preparedness Cycle. Plan" from the Federal Emergency Management Agency (FEMA) website. "Planning makes it possible to manage the entire life cycle of a potential crisis. Strategic and operational planning establishes priorities, identifies expected levels of performance and capability requirements, provides the standard for assessing capabilities and helps stakeholders learn their roles. The planning elements identify what an organization’s Standard Operating Procedures (SOPs) or Emergency Operations Plans (EOPs) should include for ensuring that contingencies are in place for delivering the capability during a large-scale disaster." [fema.gov/ plan]
The arrow ring chart example "National Preparedness Cycle" was created using the ConceptDraw PRO diagramming and vector drawing software extended with the Target and Circular Diagrams solution from the Marketing area of ConceptDraw Solution Park.
www.conceptdraw.com/ solution-park/ marketing-target-and-circular-diagrams
Arrow ring chart
 IDEF0 Diagrams
IDEF0 Diagrams visualize system models using the Integration Definition for Function Modeling (IDEF) methodology. Use them for analysis, development and integration of information and software systems, and business process modelling.
Value Stream Mapping for the Lean Office
")
Types of Flowchart - Overview


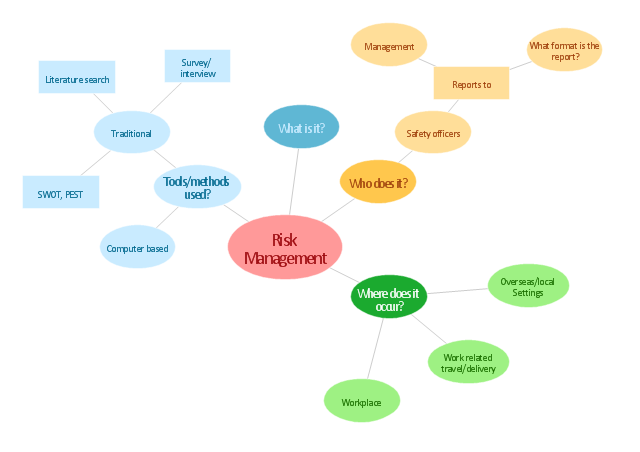
"Risk management is the identification, assessment, and prioritization of risks (defined in ISO 31000 as the effect of uncertainty on objectives, whether positive or negative) followed by coordinated and economical application of resources to minimize, monitor, and control the probability and/ or impact of unfortunate events or to maximize the realization of opportunities. Risks can come from uncertainty in financial markets, threats from project failures (at any phase in design, development, production, or sustainment life-cycles), legal liabilities, credit risk, accidents, natural causes and disasters as well as deliberate attack from an adversary, or events of uncertain or unpredictable root-cause. ... Methods, definitions and goals vary widely according to whether the risk management method is in the context of project management, security, engineering, industrial processes, financial portfolios, actuarial assessments, or public health and safety.
The strategies to manage threats (uncertainties with negative consequences) typically include transferring the threat to another party, avoiding the threat, reducing the negative effect or probability of the threat, or even accepting some or all of the potential or actual consequences of a particular threat, and the opposites for opportunities (uncertain future states with benefits)." [Risk management. Wikipedia]
The concept map example "Risk management" was created using the ConceptDraw PRO diagramming and vector drawing software extended with the Concept Maps solution from the area "What is a Diagram" of ConceptDraw Solution Park.
Concept map
Internet solutions with ConceptDraw PRO

ConceptDraw Arrows10 Technology

Cisco Network Icons

DFD Library — Design elements

- Disaster Management Cycle Draw A Flowchart And Describe It
- Draw A Flowchart For Disaster Management Cycle
- Disaster Management Pie Chart And Bar Graph For Maths
- Disaster Management Of Bar Graph
- About Disaster Management Cycle Flow Chart Drawing
- Pie Chart On Disaster Management
- Disaster Management Cycle Flow Chart
- Emergency management exercise cycle | Circular Flow Diagram ...
- Circular Arrows | Circular Arrow | Emergency management exercise ...
- Drawing For Disaster Management I On Chart
- Bargraph About Disaster Management
- Pie Chart Or Graph Of Disaster Management
- Disaster Management Chart And Diagrams
- Disaster Management Related Diagram
- Flow Chart On Disaster Management
- National Preparedness Cycle - Arrow ring chart | Disaster ...
- Charts On Disaster Management
- Emergency Plan | Emergency management process | Top iPad ...
- Mathematics | Pie Charts | Venn Diagrams | Disaster Management ...
- Chart Drawing In Disaster Management