This example of a Top Level Context Diagram for an information system management process was redesigned from the Wikipedia file: IDEF Top-Level Context Diagram.jpg. [en.wikipedia.org/ wiki/ File:IDEF_ Top-Level_ Context_ Diagram.jpg]
"Graphical notation.
IDEF0 is a model that consists of a hierarchical series of diagrams, text, and glossary cross referenced to each other. The two primary modeling components are:
(1) functions (represented on a diagram by boxes), and
(2) data and objects that interrelate those functions (represented by arrows).
... the position at which the arrow attaches to a box conveys the specific role of the interface. The controls enter the top of the box. The inputs, the data or objects acted upon by the operation, enter the box from the left. The outputs of the operation leave the right-hand side of the box. Mechanism arrows that provide supporting means for performing the function join (point up to) the bottom of the box.
The IDEF0 process.
The IDEF0 process starts with the identification of the prime function to be decomposed. This function is identified on a “Top Level Context Diagram,” that defines the scope of the particular IDEF0 analysis. ... From this diagram lower-level diagrams are generated." [IDEF0. Wikipedia]
The IDEF0 diagram example "Top-level context diagram" was created using the ConceptDraw PRO diagramming and vector drawing software extended with the IDEF0 Diagrams solution from the Software Development area of ConceptDraw Solution Park.
IDEF0 diagram

Program Structure Diagram

Gane Sarson Diagram

Venn Diagram Examples for Problem Solving. Computer Science. Chomsky Hierarchy

Venn Diagram Examples for Problem Solving. Computer Science. Chomsky Hierarchy
Diagram Flow Chart

 IDEF Business Process Diagrams
Use the IDEF Business Process Diagrams solution to create effective database designs and object-oriented designs, following the integration definition methodology.
Pyramid Diagram

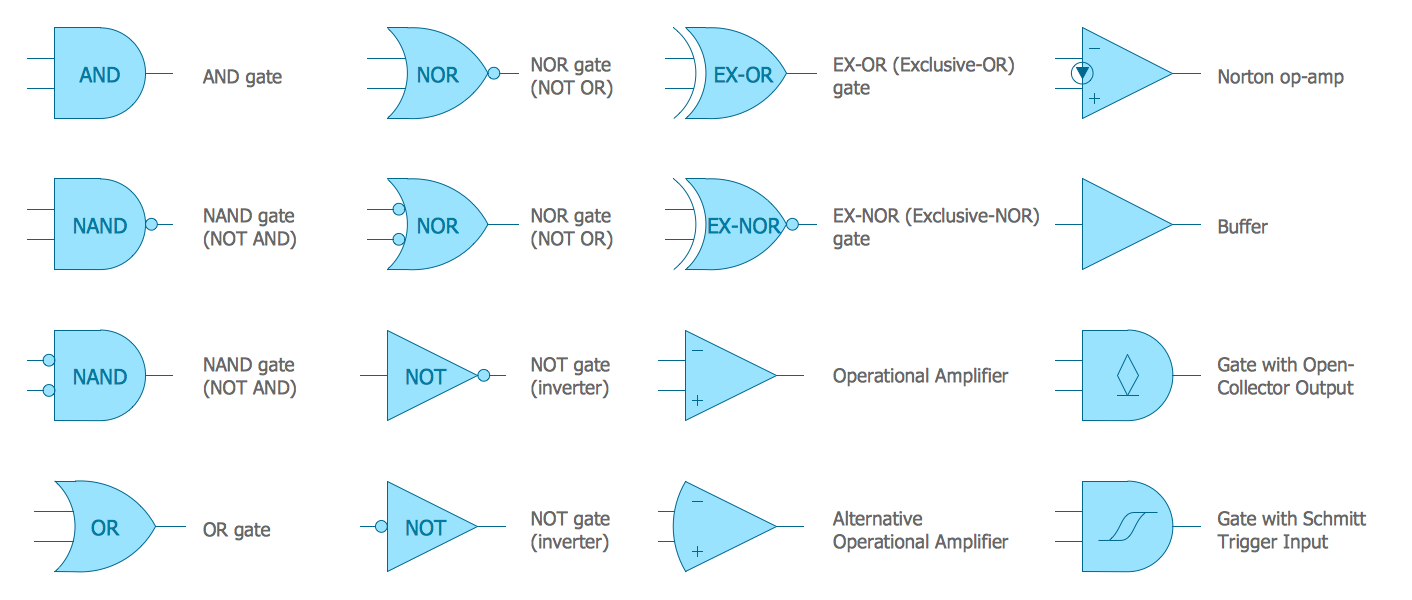
Electrical Symbols — Logic Gate Diagram
Create Process Flowcharts

- Flowcharts | Level 0 Dfd For Accounts Receivable
- Context Diagram And Level 0 Dfd
- Level 0 Data Flow Diagram Wiki
- Context Diagram Template | DFD Library System | Example of DFD ...
- Top- level context diagram | IDEF0 Diagrams | Process Flowchart ...
- Process Context Diagram
- IDEF0 diagram - Inter-box connections | Top- level context diagram ...
- 4 Level pyramid model diagram - Information systems types | 5 Level ...
- SysML block definition diagram - Function Breakdown model | Event ...
- Accounting Information Systems Flowchart Symbols | IDEF3 ...