HelpDesk
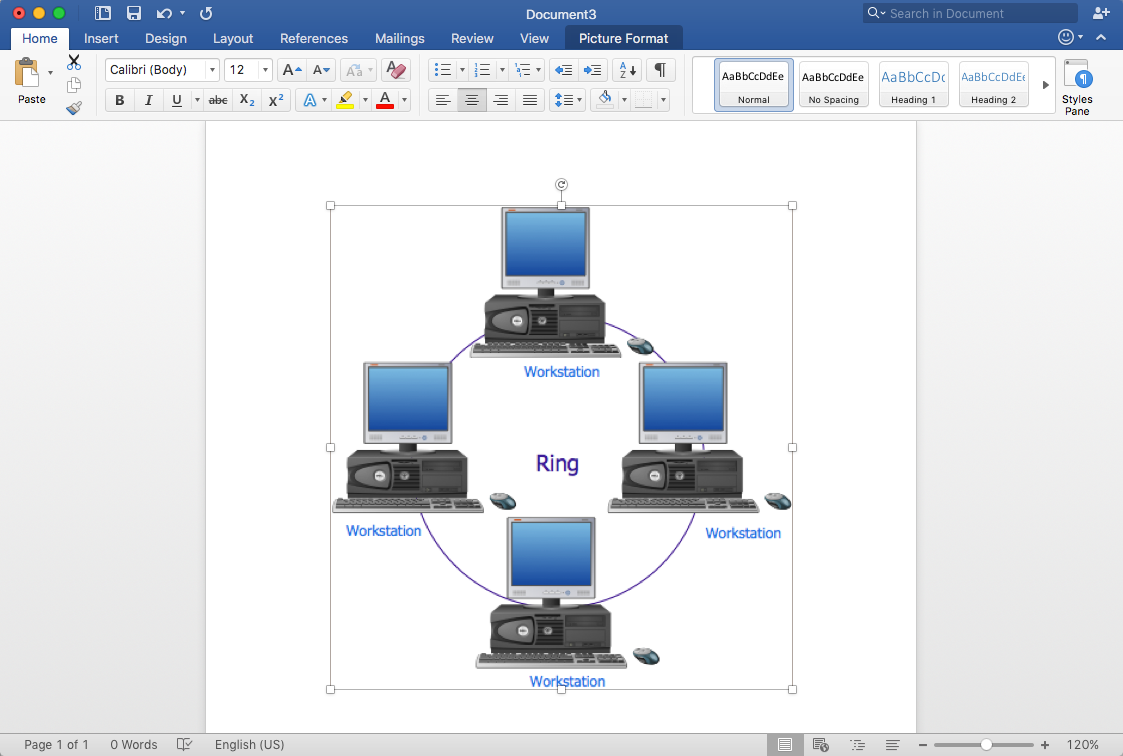
How to Add a Network Diagram to MS Word
Effective management of the computer network of any size includes the creation and maintenance of the network documentation package. Computer network diagrams may be the part of the network documentation that is often presented as MS Word document. Network diagrams describing the topology of the network and equipment installed in the network, are the essential part of this package. ConceptDraw DIAGRAM provides network administrators with ability to easily create computer network diagrams and then insert them into a MS Word document.HelpDesk
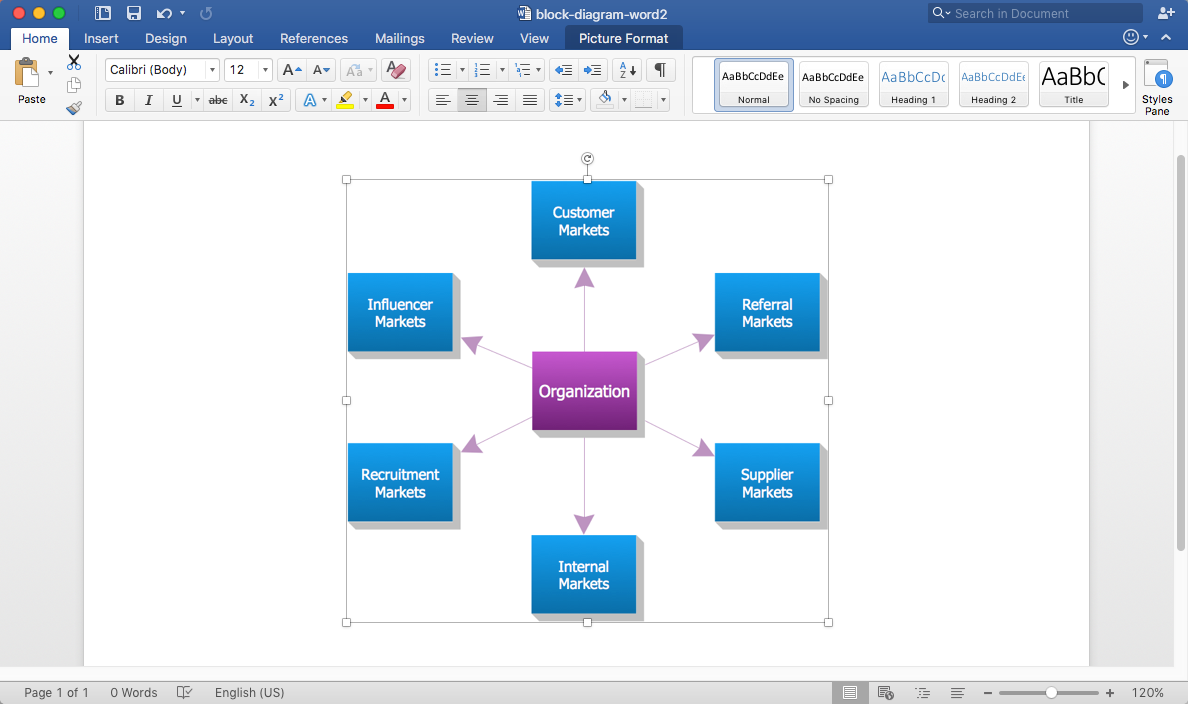
How to Add a Block Diagram to an MS Word ™ Document
Block diagram consists of graphic blocks. Blocks are connected by lines or arrows. Block diagrams are used to show the relationship between parts of some systems. It can be used for the development of new systems or to improve existing ones. The structure of the block diagram gives a high-level overview of the major components of the system, as well as the important relationships. Using the block diagrams, you can more effectively present the business data contained in your MS Word documents. ConceptDraw DIAGRAM allows you to easily create block diagrams and then insert them into an MS Word document.HelpDesk
How to Add a Fishbone (Ishikawa) Diagram to an MS Word Document
The ability to create a fishbone (Ishikawa) Diagram is supported by the ConceptDraw Fishbone Diagram solution. ConceptDraw DIAGRAM allows you to easily create a fishbone diagrams and then insert them into a MS Word document.Circle Spoke Diagram Template
ConceptDraw DIAGRAM diagramming and vector drawing software offers the Circle Spoke Diagram Template included in the Circle-Spoke Diagrams Solution from the "Diagrams" Area. Use of ready template is the easiest way of drawing professional looking Circle-Spoke Diagrams.HelpDesk
How To Create a Concept Map in Visio
ConceptDraw DIAGRAM allows you to easily create concept maps and then make an MS Visio file from your diagrams in a few simple steps.Activity on Node Network Diagramming Tool
Activity on Node Network Diagramming Tool — Activity Network and Project Evaluation and Review Technique, or PERT, charts are a way of documenting and analyzing the tasks in a project. This sample shows the Activity on node network diagramming method. It was created in ConceptDraw DIAGRAM diagramming and vector drawing software using the Seven Management and Planning Tools solution from the Management area of ConceptDraw Solution Park.ERD Symbols and Meanings
Entity Relationship Diagram (ERD) is a popular software engineering tool for database modeling and illustration the logical structure of databases, which uses one of two notations - Chen's or Crow’s Foot. Crow's foot notation is effective when used in software engineering, information engineering, structured systems analysis and design. Each of these notations applies its own set of ERD symbols. Crow's foot diagrams use boxes to represent entities and lines between these boxes to show relationships. Varied shapes at the ends of lines depict the cardinality of a given relationship. Chen's ERD notation is more detailed way to represent entities and relationships. ConceptDraw DIAGRAM application enhanced with all-inclusive Entity-Relationship Diagram (ERD) solution allows design professional ER diagrams with Chen's or Crow’s Foot notation on your choice. It contains the full set of ready-to-use standardized ERD symbols and meanings helpful for quickly drawing, collection of predesigned ERD samples, examples and templates. ConceptDraw Pro is a great alternative to Visio for Mac users as it offers more features and can easily handle the most demanding professional needs.
Cloud Computing Architecture Diagrams
For documenting the Cloud Computing Architecture with a goal to facilitate the communication between stakeholders are successfully used the Cloud Computing Architecture diagrams. It is convenient and easy to draw various Cloud Computing Architecture diagrams in ConceptDraw DIAGRAM software with help of tools of the Cloud Computing Diagrams Solution from the Computer and Networks Area of ConceptDraw Solution Park.ConceptDraw DIAGRAM ER Diagram Tool
Entity-relationship model, also called ER-model, is the main tool of domain modeling on the stage of conceptual design. The modeling of domain data structures is based on the use of graphical tools - Entity-Relationship diagrams (ER-diagrams). The core concepts of ER-Diagram are entity, attribute and relationship. ER-diagram lets visually represent the entities, helps effectively document all properties of designed system and to detail the data storages. To represent the elements at ER-model are commonly used Chen’s notation and Crow’s foot notation, each has its pros and cons. The entity on ER-diagram is represented in the form of rectangle, which specifies its name. An attribute is a property of the entity and relationship is an interaction between the entities. The relationship between two entities is called binary, between more than two entities - ternary. Specific software, such as ConceptDraw DIAGRAM with Entity-Relationship Diagram (ERD) solution from ConceptDraw Solution Park is helpful for easy creation Entity-Relationship Diagrams.- Entity Relationship Diagram Symbols | ConceptDraw PRO ER ...
- How to Add a Bubble Diagram to a MS Word Document Using ...
- How to Add a Block Diagram to a PowerPoint Presentation Using ...
- How to Create Presentation of Your Project Gantt Chart ...
- How To Create a MS Visio Cause and Effect Diagram Using ...
- How To Create a PERT Chart | How to Create Project Diagrams on ...
- How To use House Electrical Plan Software | Electrical Symbols ...
- How to Add a Fishbone (Ishikawa) Diagram to a MS Word Document ...
- Cross-Functional Flowchart | Double-headed Cross Functional ...
- Social determinants of health | Process Flowchart | Venn Diagram ...