LLNL Flow Charts
These flow charts help scientists analysts and other decision makers to visualize the complex interrelationships involved in managing our nation x2019.
 USA Maps
Use the USA Maps solution to create a map of USA, a US interstate map, printable US maps, US maps with cities and US maps with capitals. Create a complete USA states map.
This wheel diagram sample was created on the base of figure illustrating the webpage "Chapter 3: Current State of the Ecosystem" of the website of the National Broadband Plan of US Federal Communications Comission (FCC). "The broadband ecosystem includes applications and content: e-mail, search, news, maps, sales and marketing applications used by businesses, user-generated video and hundreds of thousands of more specialized uses. Ultimately, the value of broadband is realized when it delivers useful applications and content to end-users.
Applications run on devices that attach to the network and allow users to communicate: computers, smartphones, set-top boxes, e-book readers, sensors, private branch exchanges (PBX), local area network routers, modems and an ever-growing list of other devices. New devices mean new opportunities for applications and content.
Finally, broadband networks can take multiple forms: wired or wireless, fixed or mobile, terrestrial or satellite. Different types of networks have different capabilities, benefits and costs.
The value of being connected to the network increases as more people and businesses choose to adopt broadband and use applications and devices that the network supports. Several factors contribute to their decisions. These include whether they can afford a connection, whether they are comfortable with digital technology and whether they believe broadband is useful.
Networks, devices and applications drive each other in a virtuous cycle. If networks are fast, reliable and widely available, companies produce more powerful, more capable devices to connect to those networks. These devices, in turn, encourage innovators and entrepreneurs to develop exciting applications and content. These new applications draw interest among end-users, bring new users online and increase use among those who already subscribe to broadband services. This growth in the broadband ecosystem reinforces the cycle, encouraging service providers to boost the speed, functionality and reach of their networks."
[broadband.gov/ plan/ 3-current-state-of-the-ecosystem/ ]
The circle pie chart example "Forces shaping the broadband ecosystem in the US" was created using the ConceptDraw PRO diagramming and vector drawing software extended with the Target and Circular Diagrams solution from the Marketing area of ConceptDraw Solution Park.
www.conceptdraw.com/ solution-park/ marketing-target-and-circular-diagrams
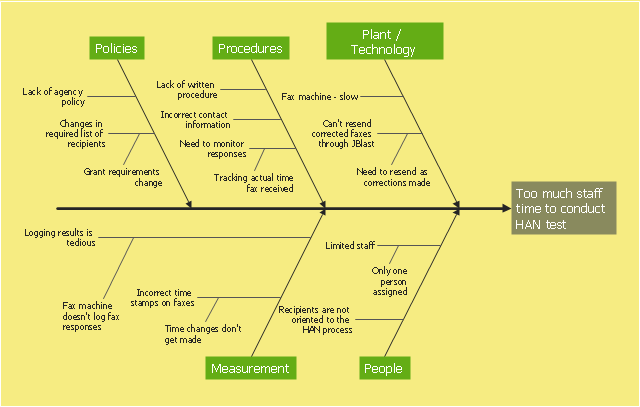
This example was created on the base of the figure from the website of Minnesota Department of Health. [health.state.mn.us/ divs/ opi/ qi/ images/ fishbone_ ex.png]
"Minnesota’s Health Alert Network (HAN) enables public health staff, tribal governments, health care providers, emergency workers, and others working to protect the public to exchange information during a disease outbreak, environmental threat, natural disaster, or act of terrorism." [health.state.mn.us/ han/ ]
The fishbone diagram example "HAN project" was created using the ConceptDraw PRO diagramming and vector drawing software extended with the Fishbone Diagrams solution from the Management area of ConceptDraw Solution Park.
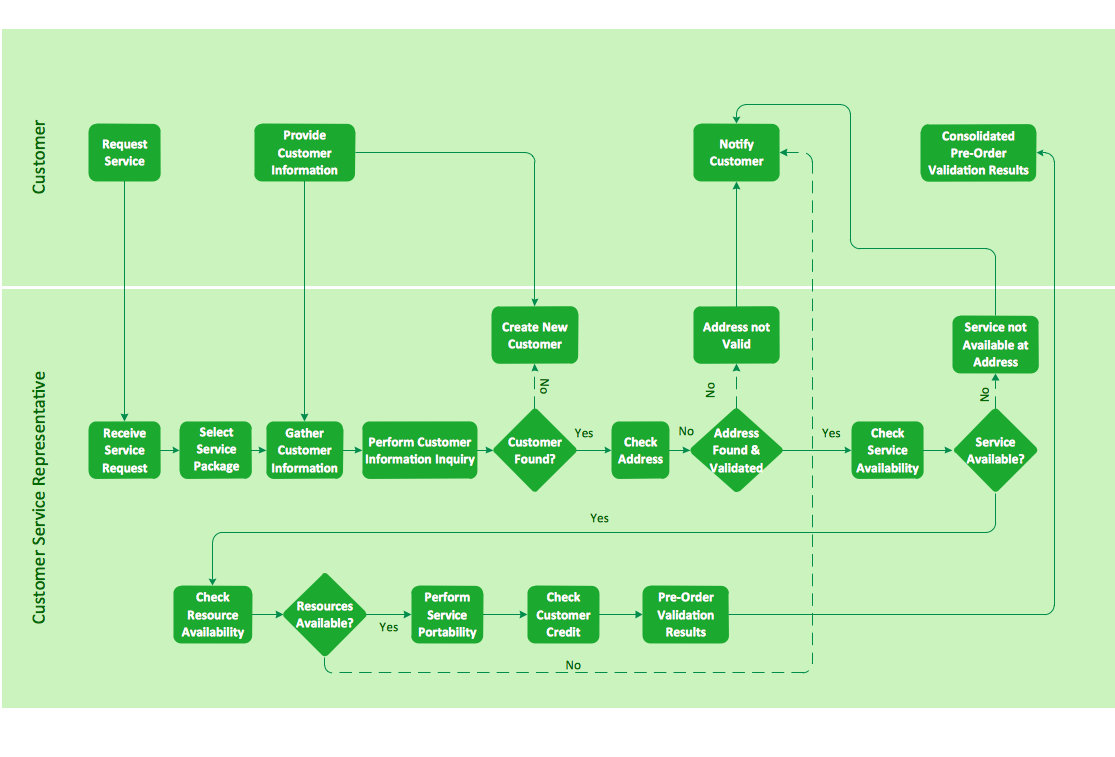
Cross-functional flowchart landscape, U.S. units
In Cross-Functional Flowchart first step is to determine how many lanes you want to represent and what the lane titles will be. The choice of vertical or horizontal swim lanes landscape comes down to personal choice or just plain “what fits best”. With ConceptDraw, we make that simple by including different swim lanes templates. Professional looking examples and templates of Swimlane Flowchart which help you create Cross Functional Flowcharts rapidly.
 Fault Tree Analysis Diagrams
This solution extends ConceptDraw PRO v9.5 or later with templates, fault tree analysis example, samples and a library of vector design elements for drawing FTA diagrams (or negative analytical trees), cause and effect diagrams and fault tree diagrams.
HelpDesk
How to Make Soccer Position Diagram Using ConceptDraw PRO
The soccer field has the form of a large rectangle, covered with grass. Dimensions of soccer fields may vary slightly, depending on the level of the game, but all fields have some common characteristics. Soccer players may take different positions. Each soccer position has its own name, and implies certain player functions. Every soccer position has a very specific name and task: Goalkeeper, Defenders, Midfielders and Forwards. During preparation for the game coach met a challenge: how to explain each player's position and his role in the game. The difficulty is the fact that in the course of the game players will often move on the field and do not stay in one place. Football field diagram with dimensions and marking, and positions - it is an important tool for the coach. ConceptDraw PRO helps both coach and players to understand exactly their roles during the particular game. The ability to create Soccer diagrams is contained in the ConceptDraw Soccer solution. The solution provides- Energy Pyramid Diagram | Energy resources diagram | U.S. energy ...
- Energy Pyramid Diagram | How to Create a Scatter Chart | U.S. ...
- Relations diagram - Health care | Prioritization matrix - Health care ...
- USA Maps | Circle-Spoke Diagrams | Area Charts | Diagram ...
- Resources and energy - Vector stencils library | Energy resources ...
- Manufacturing and Maintenance | US energy consumption by source
- USA Maps | Dashboard | Graph Or Diagram That Illustrates The ...
- Energy Pyramid Diagram | Resources and energy - Vector stencils ...
- Cross-functional flowchart landscape, U.S. units | Bubble diagrams ...
- Photooxygenation - Venn diagram
- Usa Diagram
- Design elements - Power sources | Energy Pyramid Diagram | U.S. ...
- Dashboard | USA Maps | ConceptDraw Dashboard for Facebook ...
- Wireless broadband network diagram | Forces shaping the ...
- Design elements - Power sources | U.S. energy consumption by ...
- How to Create a Timeline Diagram in ConceptDraw PRO | Federal ...
- Geo Map - USA - Minnesota | North America - Vector stencils library ...
- Scatter Diagrams | How to Draw a Scatter Diagram | Blank Scatter ...
- US Energy Flow Chart
.jpg)


