HelpDesk
How to Draw a Scatter Diagram Using ConceptDraw PRO

The vector stencils library "Computer network" contains 51 symbols of computer network devices and equipment for drawing computer network diagrams.
"Network Mapping Software.
A number of software tools exist to design computer network diagrams / or generate visual maps of networks, servers, storage, services, data centers, and other peripherals. Broadly, there are two types of software tools - those that help create diagrams manually and those that generate them using automated / semi-automated approaches.
Type of Software.
(1) Manual - allows users to design and draw logical and physical topology diagrams by manually placing icons and connections.
(2) Automated - generate topology diagrams / maps by traversing the network and automatically discovering resident devices or by importing network data." [Comparison of network diagram software. Wikipedia]
ConceptDraw PRO is the software for manual design of computer network diagrams. The solutions of the Computer and Networks area in ConceptDraw Solution Park extend ConceptDraw PRO with vector stencils libraries, templates and examples for creating the computer network diagrams.
The symbols example "Computer network - Vector stencils library" was created using the ConceptDraw PRO diagramming and vector drawing software extended with the Computer and Networks solution from the Computer and Networks area of ConceptDraw Solution Park.
www.conceptdraw.com/ solution-park/ computer-and-networks
Laptop

Desktop computer

Firewall

Bus

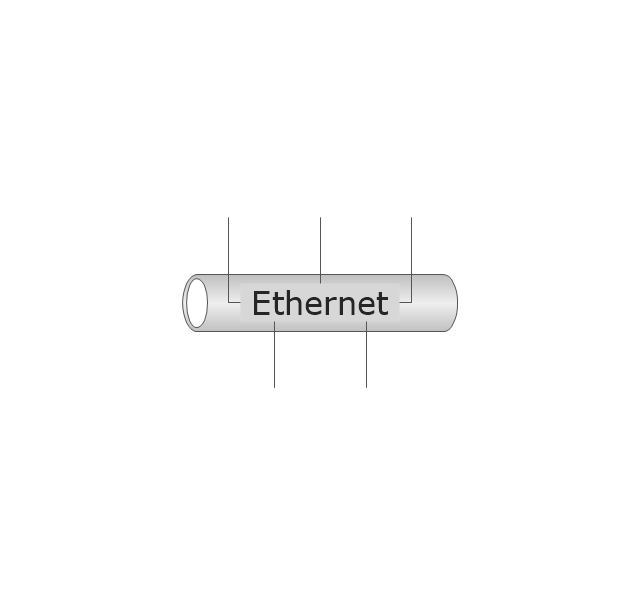
Ethernet
Star network

FDDI Ring

Token-ring

Comm-link

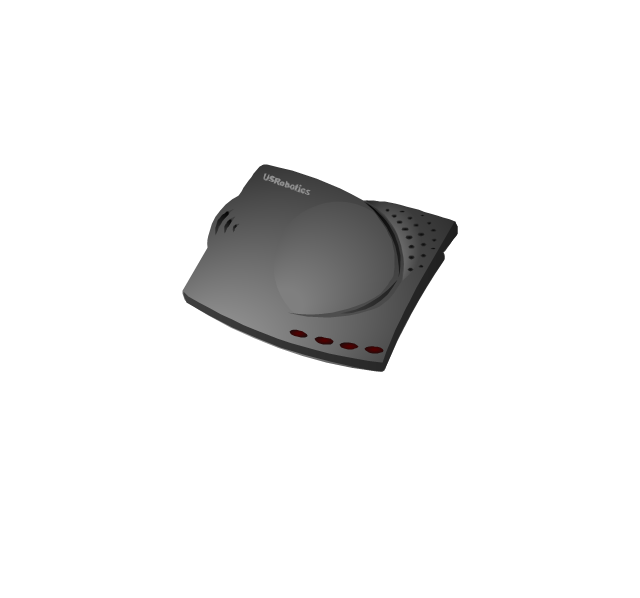
Modem
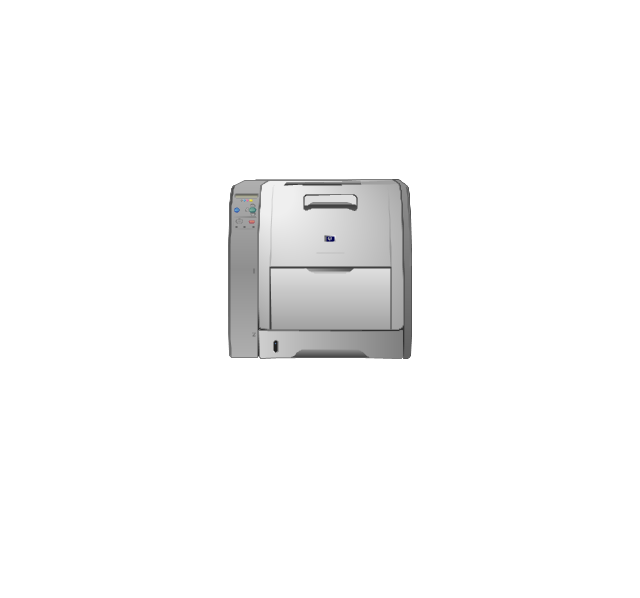
Laser printer
Inkjet printer
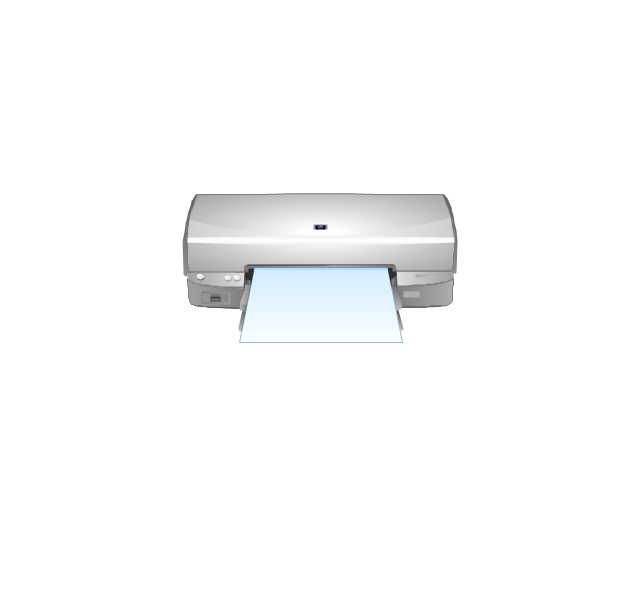
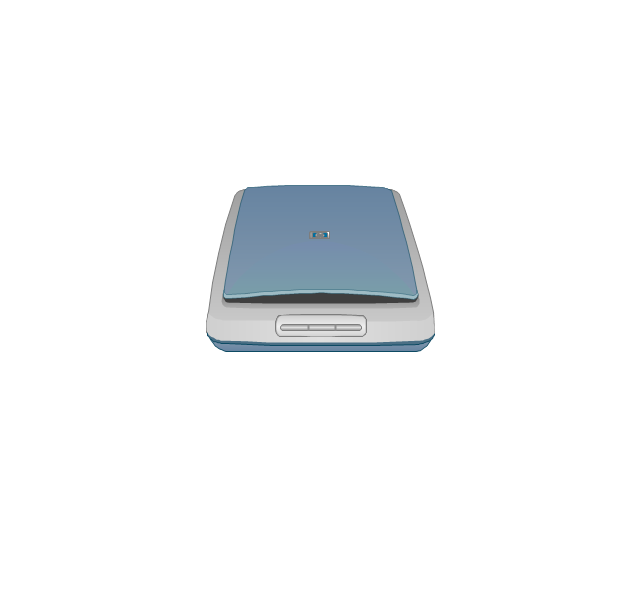
Image scanner
City

Ethernet hub

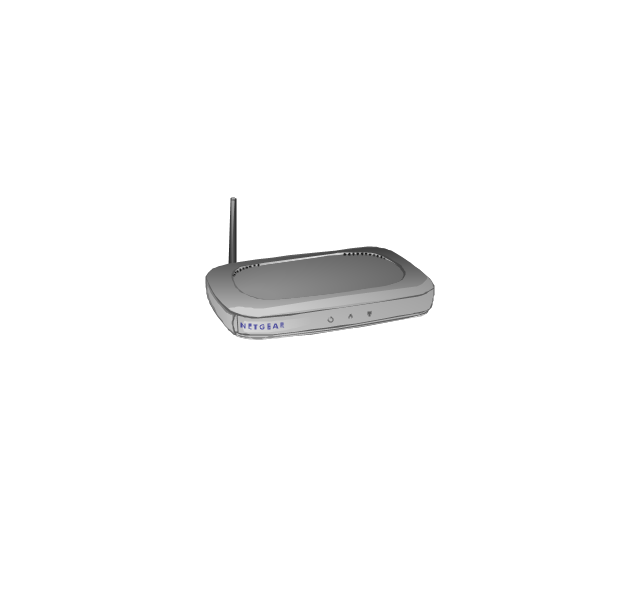
Wireless router
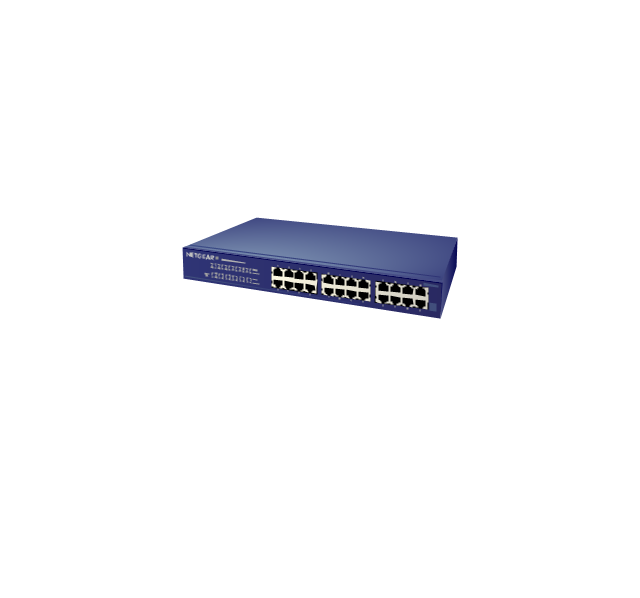
Network switch
iPod Classic

iPhone/ iPod Touch

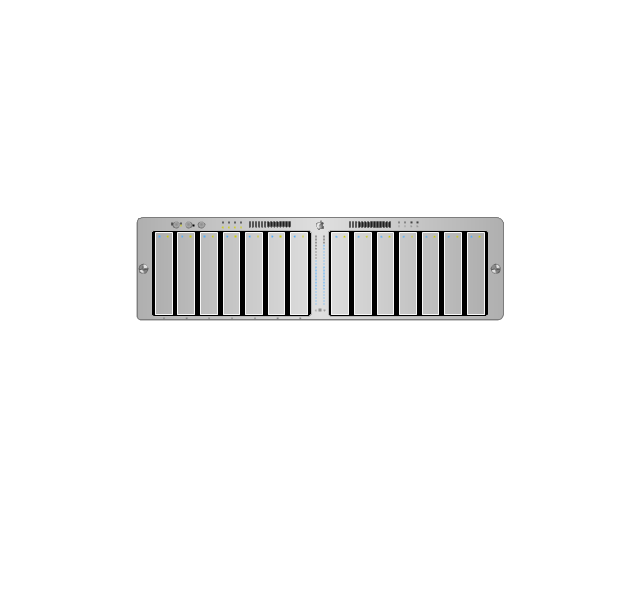
Xserve RAID
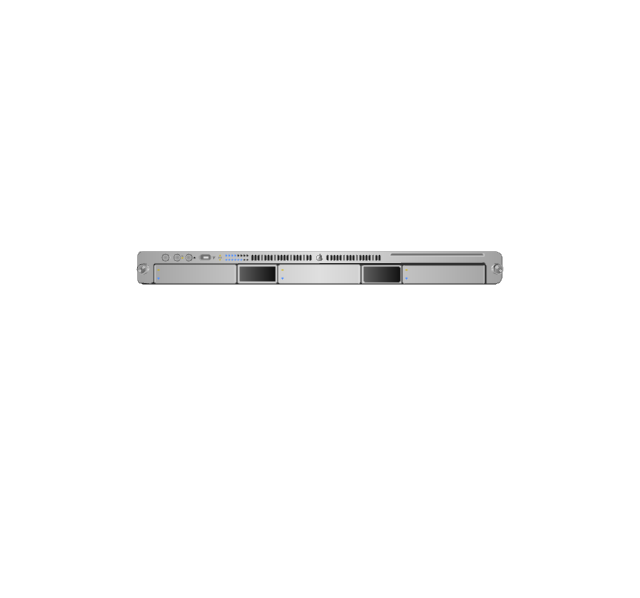
XServe
Apple Thunderbolt Display

Data store

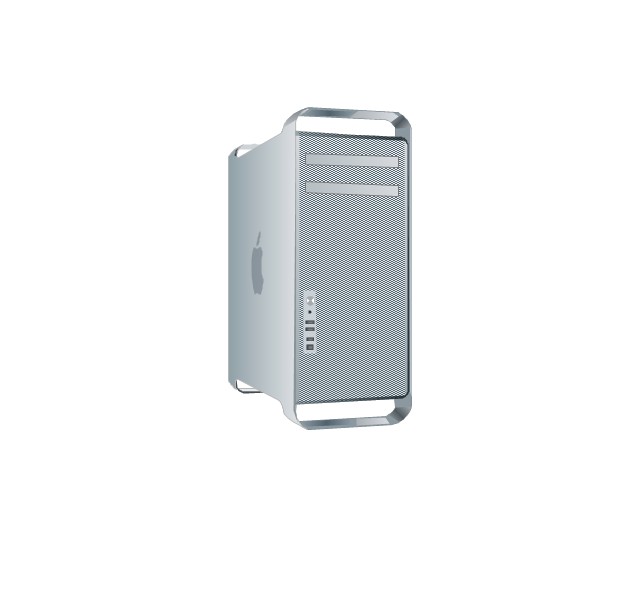
Mac Pro
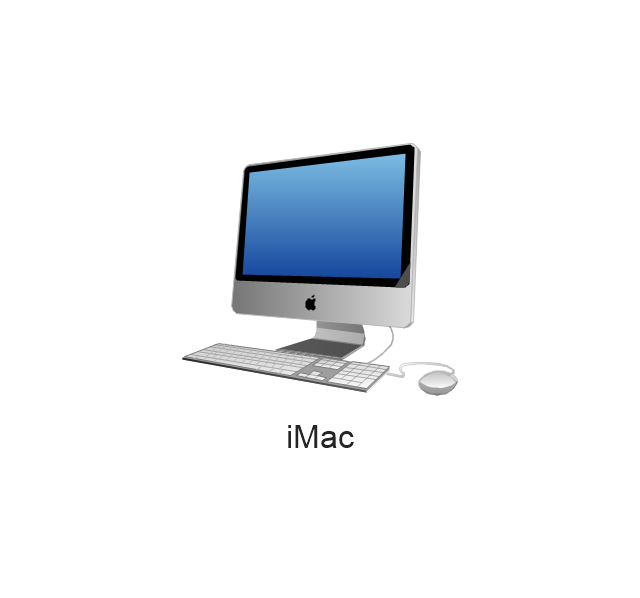
iMac
RAID

Mainframe

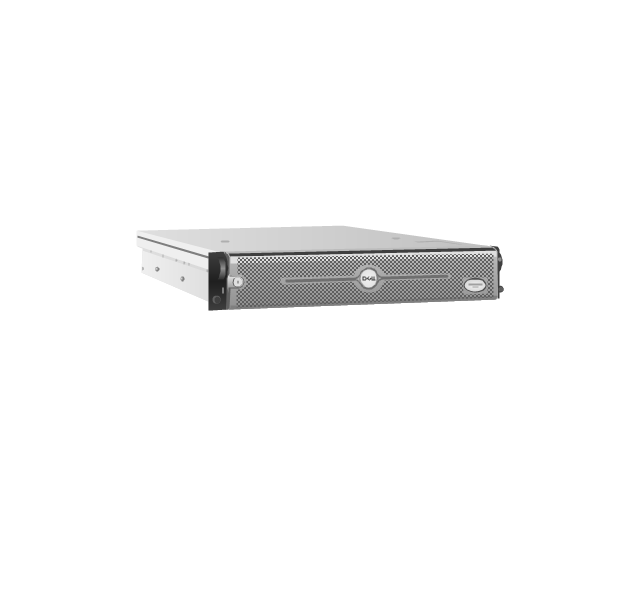
Rack-mountable server
Server

PDA

Cloud

Computer monitor
Workstation

Router
IP Phone
Fax
Mobile phone
Smartphone
Compact Disk

Mouse

Apple Wireless Mouse

Computer keyboard
Apple Keyboard
Radio tower

Satellite dish

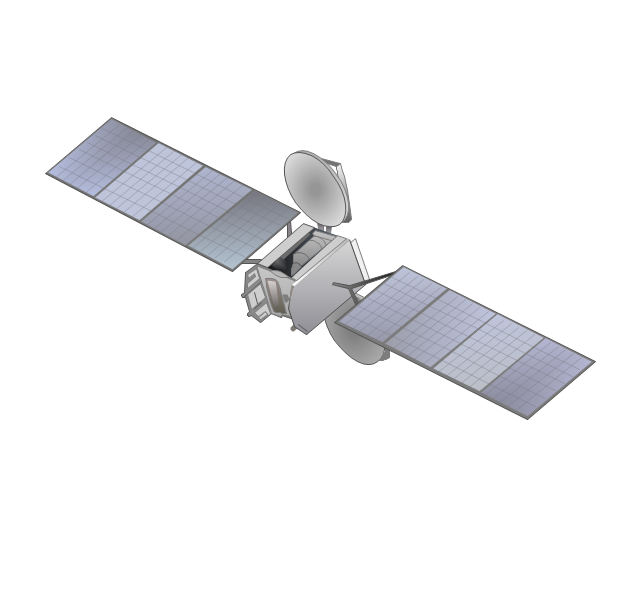
Satellite
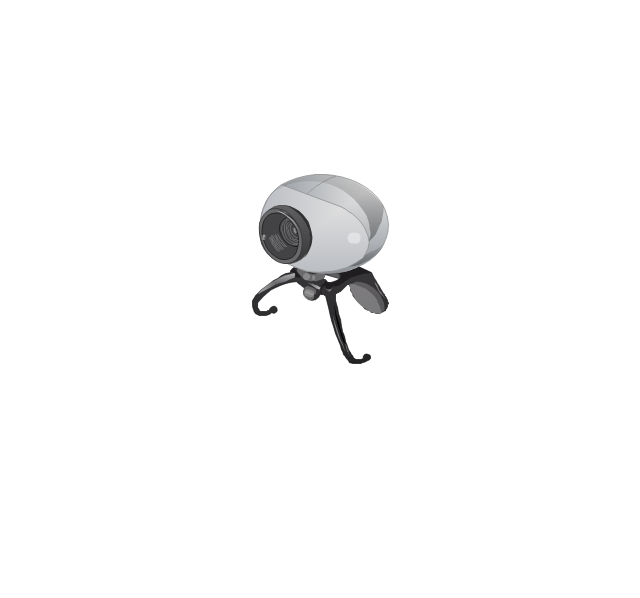
Webcam
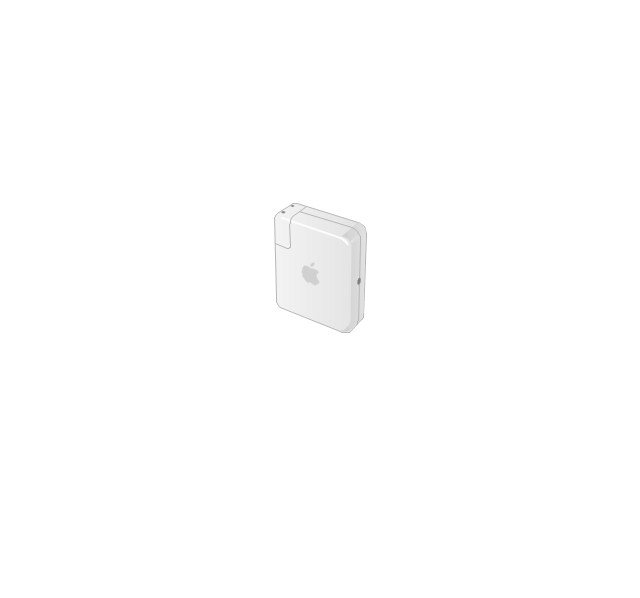
AirPort Extreme

Airport Express
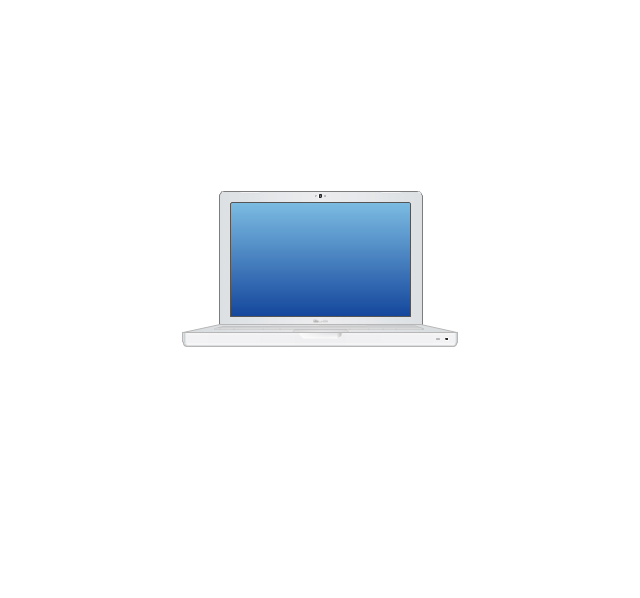
MacBook
iPhone 4

HelpDesk
How to Draw a Pareto Chart Using ConceptDraw PRO

- Tree Network Topology Diagram | Wireless Network Drawing ...
- Tree Network Topology Diagram | Wireless Network Drawing | Cisco ...
- Wireless Network Topology | Hotel Network Topology Diagram | Star ...
- GPRS network diagram | Tree Network Topology Diagram | Building ...
- Tree Network Topology Diagram | Wireless Network Drawing ...
- Long-range Wi-Fi network diagram | Tree Network Topology ...
- Wireless Networks | How to Create a Wireless Network Diagram ...
- Tree Network Topology Diagram
- Wireless Network Drawing | GPRS network diagram | Wireless ...
- Diagram Of Cell In Computer
- Mobile satellite TV network diagram | Building Networks | Personal ...
- Mesh Network Topology Diagram | Cisco IBM. Cisco icons, shapes ...
- Cell Diagram
- Cellular Internet Structure
- Hotel Network Topology Diagram . Hotel Guesthouse WiFi Network ...
- Telecommunication Network Diagrams | Design elements ...
- Wireless Networks | Long-range Wi-Fi network diagram | Illustrate ...
- Tree Network Topology Diagram | Fully Connected Network ...
- Network Architecture | Wireless Networks | Near-me area networks ...