 Health Food
The Health Food solution contains the set of professionally designed samples and large collection of vector graphic libraries of healthy foods symbols of fruits, vegetables, herbs, nuts, beans, seafood, meat, dairy foods, drinks, which give powerful possi
 Cooking Recipes
Create quick and easy recipe diagrams with the Cooking Recipes solution. Make a tasty meal for dinner, for holidays, or for a party.
 Biology
Biology solution extends ConceptDraw DIAGRAM software with samples, templates and libraries containing biological vector symbols, to help you create scientific and educational designs in the field of biology.
 Area Charts
Area Charts are used to display the cumulative totals over time using numbers or percentages; or to show trends over time among related attributes. The Area Chart is effective when comparing two or more quantities. Each series of data is typically represented with a different color, the use of color transparency in an object’s transparency shows overlapped areas and smaller areas hidden behind larger areas.
How can you illustrate the weather condition

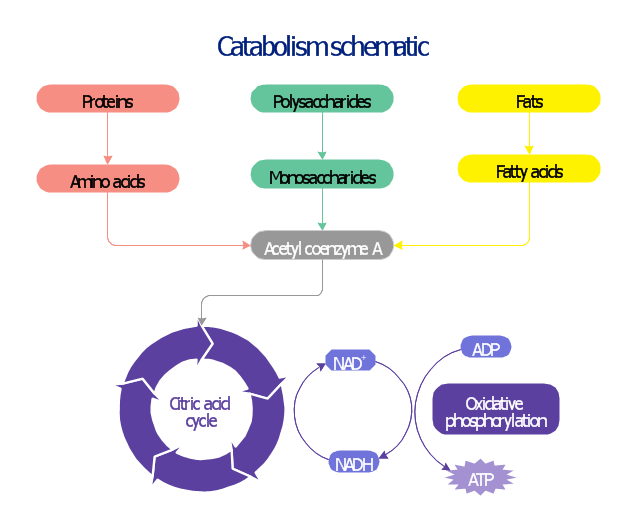
This biochemical chart display how proteins, polysaccharides and fats from food are digested into gastrointestinal tract into aminoacids, monosaccharides and fatty acids, and then broken down and oxidized to carbon dioxide and water in cellular processes of energy generation.
This metabolic pathway map was redesigned from Wikipedia file: Catabolism schematic.svg. [en.wikipedia.org/ wiki/ File:Catabolism_ schematic.svg]
The biochemical diagram example "Catabolism schematic" was created using the ConceptDraw PRO diagramming and vector drawing software extended with the Biology solution from the Science and Education area of ConceptDraw Solution Park.
Catabolic pathway map
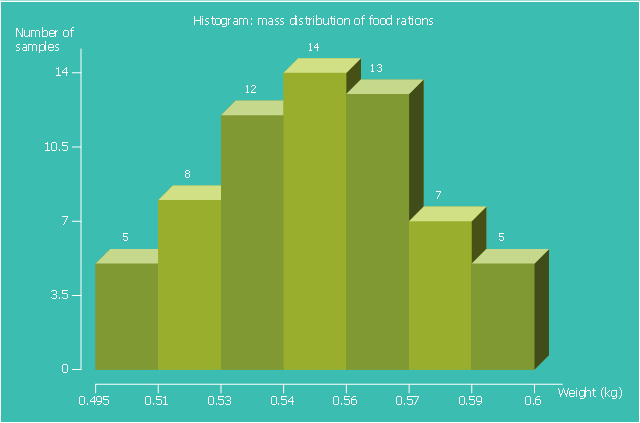
This histogram sample shows the mass distribution of food rations.
It was designed on the base of the Wikimedia Commons file: Histo alimentaire.svg. [commons.wikimedia.org/ wiki/ File:Histo_ alimentaire.svg]
This file is licensed under the Creative Commons Attribution-Share Alike 3.0 Unported license. [creativecommons.org/ licenses/ by-sa/ 3.0/ deed.en]
"In nutrition, diet is the sum of food consumed by a person or other organism. The word diet often implies the use of specific intake of nutrition for health or weight-management reasons (with the two often being related). Although humans are omnivores, each culture and each person holds some food preferences or some food taboos. This may be due to personal tastes or ethical reasons. Individual dietary choices may be more or less healthy.
Complete nutrition requires ingestion and absorption of vitamins, minerals, and food energy in the form of carbohydrates, proteins, and fats. Dietary habits and choices play a significant role in the quality of life, health and longevity." [Diet (nutrition). Wikipedia]
The histogram example "Mass distribution of food rations" was created using the ConceptDraw PRO diagramming and vector drawing software extended with the Histograms solution from the Statistical Charts and Diagrams area of ConceptDraw Solution Park.
Histogram
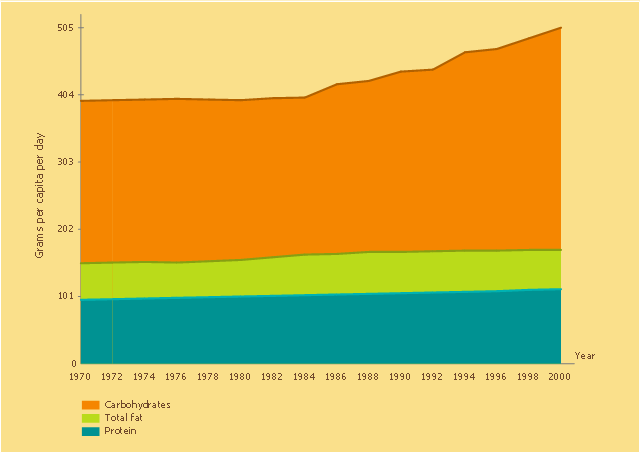
This area chart sample was designed on the base of line graph "Figure 9. U.S. food supply of macronutrients in grams per capita per day, 1970–2000. Data from Food Consumption Data System, Economic Research Service, U.S. Department of Agriculture" in the article "Childhood Obesity — What We Can Learn From Existing Data on Societal Trends, Part 2" by Roland Sturm from the website of the US Centers for Disease Control and Prevention (CDC).
"A line graph shows three lines, one indicating protein consumption, one indicating fat consumption, and one indicating carbohydrate consumption over a 31-year period, from 1970 to 2000. The line indicating protein remains fairly constant at the 100-gram level, increasing slightly from 96 grams in 1970 to 112 grams in 2000. The line indicating fat started at 151 grams in 1970, trending slightly upward after 1980, and reached 171 grams in 2000. The line indicating carbohydrates remains fairly constant from 1970 to 1982, starting at 395 grams in 1970 to 399 grams in 1982, but then rises steadily to reach 505 grams in 2000."
[cdc.gov/ pcd/ issues/ 2005/ apr/ 04_ 0039.htm#9]
The area graph example "U.S. food supply of macronutrients in grams per capita per day" was created using the ConceptDraw PRO diagramming and vector drawing software extended with the Area Charts solution from the Statistical Charts and Diagrams area of ConceptDraw Solution Park.
Area chart
Educational Technology Tools
Education Information
- Diagram Of Carbohydrates Foods
- Examples Of Carbohydrates Food Drawing
- Bio Flowchart Lite | Business Diagram Software | Biology Symbols ...
- Easy Food Carbohydrates To Draw
- Carbohydrates Food Drawing Pic
- Carbohydrate Food Drawings
- Biology Drawing | Classification Of Carbohydrate Flow Chart
- Catabolism schematic - Biochemical diagram | Health Food ...
- How to Design a Fast- Food Restaurant Menu Using ConceptDraw ...
- Flowchart Components | Carbohydrates Concept Map Answers