 Health Food
The Health Food solution contains the set of professionally designed samples and large collection of vector graphic libraries of healthy foods symbols of fruits, vegetables, herbs, nuts, beans, seafood, meat, dairy foods, drinks, which give powerful possi
Use the vector clipart library Food to draw illustrations on meal and drink, food and beverage, diet, cuisine, cooking, healty nutrition, fast food.
"Food is any substance consumed to provide nutritional support for the body. It is usually of plant or animal origin, and contains essential nutrients, such as carbohydrates, fats, proteins, vitamins, or minerals. The substance is ingested by an organism and assimilated by the organism's cells in an effort to produce energy, maintain life, or stimulate growth." [Food. Wikipedia]
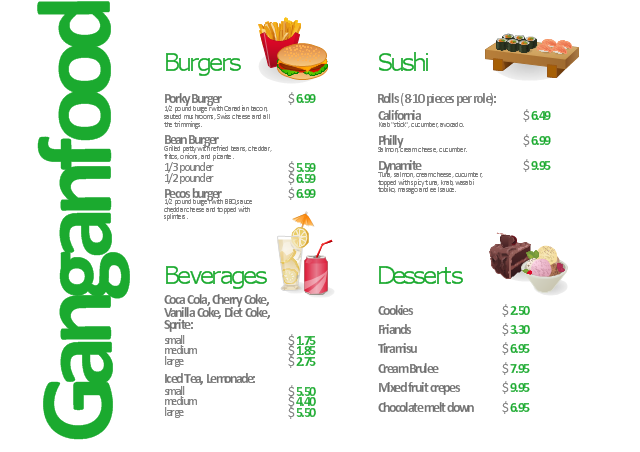
The vector graphics example Fast food restaurant menu prices was created using ConceptDraw PRO diagramming and vector drawing software extended with Artwork solution from Illustration area of ConceptDraw Solution Park.
"Food is any substance consumed to provide nutritional support for the body. It is usually of plant or animal origin, and contains essential nutrients, such as carbohydrates, fats, proteins, vitamins, or minerals. The substance is ingested by an organism and assimilated by the organism's cells in an effort to produce energy, maintain life, or stimulate growth." [Food. Wikipedia]
The vector graphics example Fast food restaurant menu prices was created using ConceptDraw PRO diagramming and vector drawing software extended with Artwork solution from Illustration area of ConceptDraw Solution Park.
Infographics
Biology Drawing Software

Biology Illustration

 Cooking Recipes
Create quick and easy recipe diagrams with the Cooking Recipes solution. Make a tasty meal for dinner, for holidays, or for a party.
 Area Charts
Area Charts are used to display the cumulative totals over time using numbers or percentages; or to show trends over time among related attributes. The Area Chart is effective when comparing two or more quantities. Each series of data is typically represented with a different color, the use of color transparency in an object’s transparency shows overlapped areas and smaller areas hidden behind larger areas.
 Biology
Biology solution extends ConceptDraw PRO software with samples, templates and libraries containing biological vector symbols, to help you create scientific and educational designs in the field of biology.
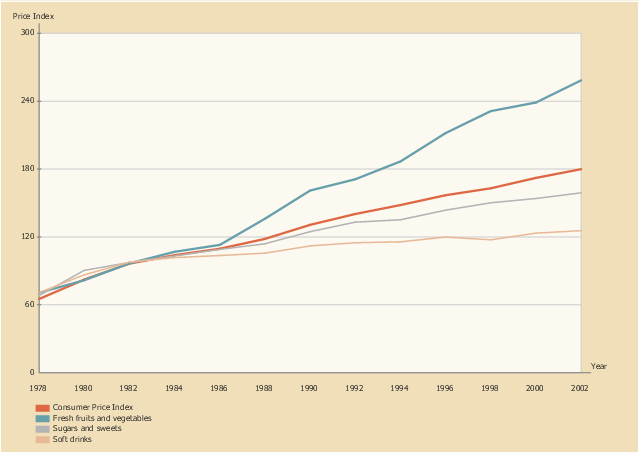
This line graph sample shows the relative price changes for fresh fruits and vegetables, sugars and sweets, and soft drinks, using the period 1982–84 as the baseline (index = 100), 1978–2002. It was designed on the base of line chart from the website of the U.S. National Center for Chronic Disease Prevention and Health Promotion.
"The number of overweight and obese youth has increased in recent decades, yet few data assess how the lives of children have changed during the “obesity epidemic.” ...
Eating as a primary activity declined, suggesting a shift toward snacking or eating as a secondary activity. Statistically significant trends exist for carbohydrate intake, especially for chips/ crackers/ popcorn/ pretzels (intake tripled from the mid-1970s to the mid-1990s) and soft drinks (intake doubled during the same period). Price and income data suggest possible economic reasons for these changes. The percentage of disposable income spent on food has declined continuously, and almost all of the decline has been represented by food consumed at home, yet today’s disposable income buys more calories than it has in the past. Relative prices have encouraged shifts across food types. From a baseline of 100 during 1982–84, the price index for fresh fruit and vegetables increased to 258 by 2002 (far exceeding general inflation), whereas the price index for soft drinks increased only to 126 by 2002 (below general inflation)." [cdc.gov/ pcd/ issues/ 2005/ apr/ 04_ 0039.htm]
The line chart example "Relative price changes for fresh fruits and vegetables, sugars, sweets, soft drinks" was created using the ConceptDraw PRO diagramming and vector drawing software extended with the Line Graphs solution from the Graphs and Charts area of ConceptDraw Solution Park.
Line chart
- Diagrams Of Carbohydrates Food
- Diagram Of Carbohydrates Food
- Carbs Food Drawing
- How To Draw Carbohydrates Food
- Food Of Carbohydrates How To Draw
- Carbohydrates Drawing
- Easy Food Carbohydrates To Draw
- Biology Drawing Software | Food Which Is Rich In Carbohydrates ...
- Which Food Contains Carbohydrates
- How To Draw An Example Of Carbohydrate As A Class Of Food
- Drawings Of Energy Foods
- Biology Symbols | Biology Drawing Software | Sales Process ...
- Draw Mineral Foods
- Biology Drawing Software | Biology Drawing | Healthy Diet Plan ...
- Design elements - Carbohydrate metabolism | Illustration Software ...
- Healthy Diet Plan | Health Food | Healthy Diet | Drawings Of ...
- How can you illustrate the weather condition | Nature Drawings ...
- Food Court | Cooking Recipes | Food Recipes | How To Draw A ...
- Health Food | Cooking Recipes | Cisco Network Icons | Importance ...
- Sales Process | Nature Drawings - How to Draw | Design elements ...