How to Draw Pictorial Chart. How to Use Infograms
How to draw pictorial chart quick, easy and effective? ConceptDraw PRO offers the unique Pictorial Infographics Solution that will help you! Pictorial Infographics solution contains large number of libraries with variety of predesigned vector pictograms that allows you design infographics in minutes. There are available 10 libraries with 197 vector pictograms.Spatial infographics Design Elements: Location Map
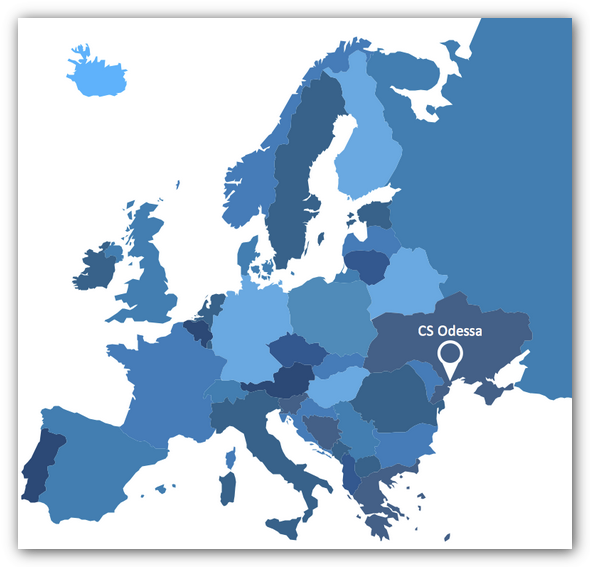
Infographic Design Elements for visually present various geographically distributed information.Typography Infographic Examples
ConceptDraw PRO extended with Typography Infographics Solution from the “What are Infographics” Area is a powerful infographic software that offers you variety of infographics examples. Use of predesigned examples as the base for your own Typography Infographics is a timesaving and useful way. Simply open the desired example, change for your needs and then successfully use it in any field of your activity.Sample Pictorial Chart. Sample Infographics
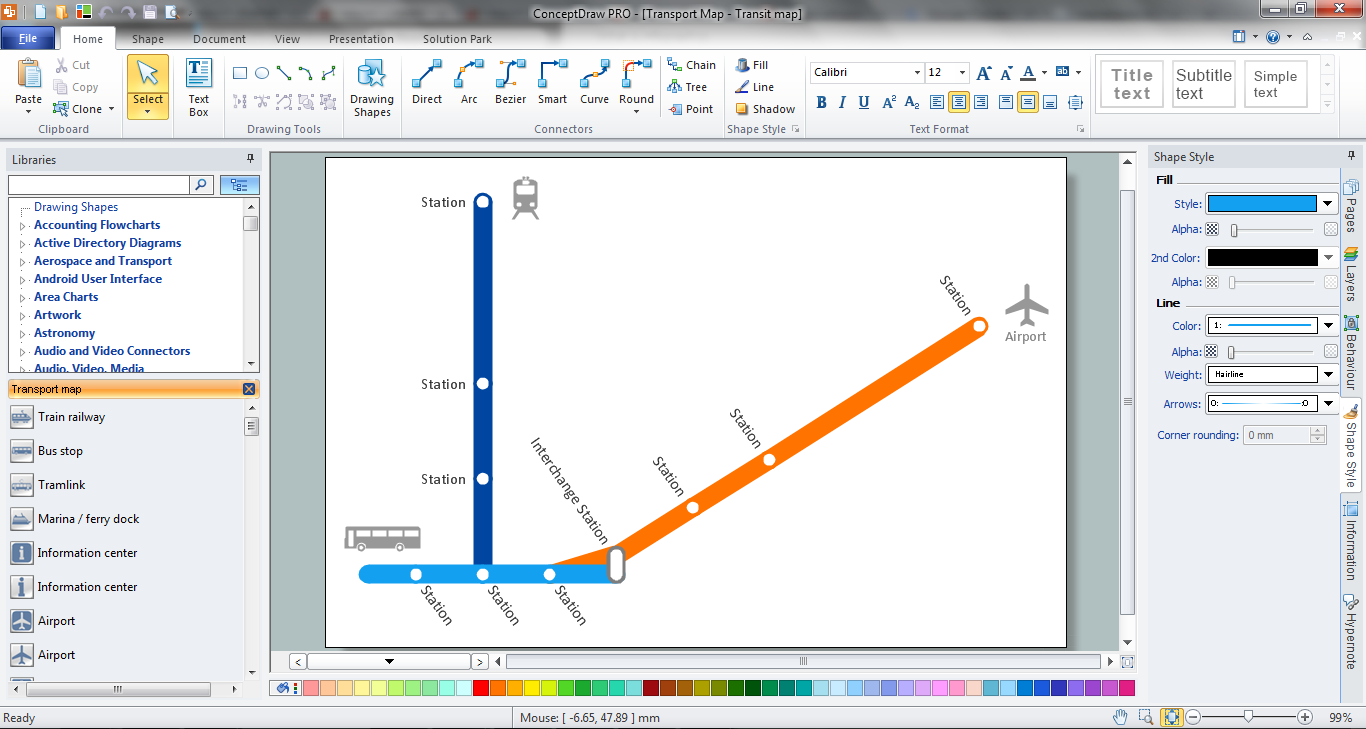
Sample Pictorial Chart - Pictorial Infographics solution provides easy-to-use design infographics drawing tools, large collection of different sample infographics and infograms, sample pictorial chart and templates to be filled in, and 10 libraries with great quantity of predesigned vector pictograms. Use Pictorial Infographics solution to draw your own design pictorial infographics documents quick and easy.Spatial infographics Design Elements: Transport Map
Do you like infographics and data visualization? Creating infographics is super-easy with ConceptDraw.Excellent Examples of Infographic Maps
Create Spatial infographics with ConceptDraw using its excellent examples of infographic maps. We hope these can inspire and teach you!The vector stencils library "HR department" contains 50 workflow symbols.
Use this department icon set to draw your HR process flowcharts, workflow diagrams and infographics with the ConceptDraw PRO diagramming and vector drawing software.
The HR pictograms library "HR department" is included in the HR Flowcharts solution from the Management area of ConceptDraw Solution Park.
HelpDesk
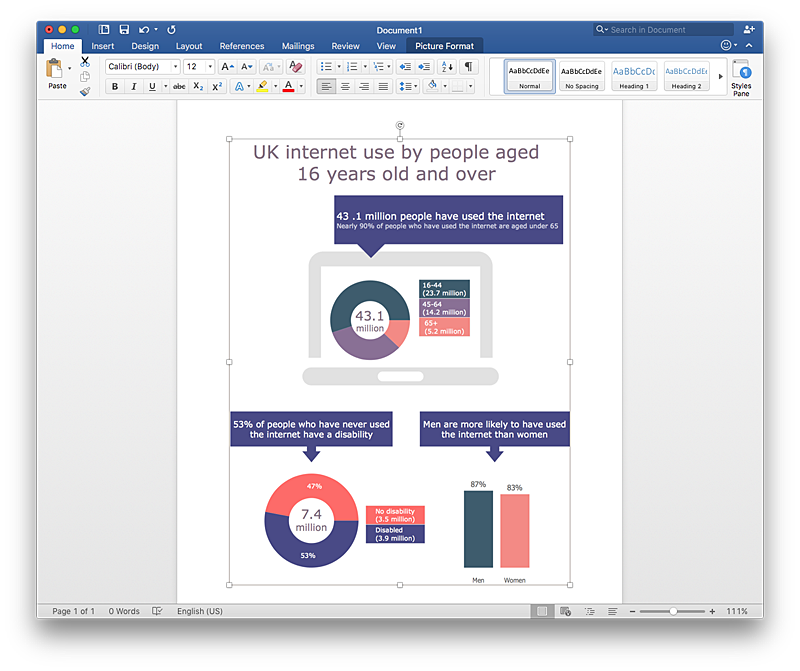
How to Add Data-driven Infographics to a MS Word Document Using ConceptDraw PRO
Infographics ae usually used as an effective way of showing a certain portion of information . There are a wide of range of subjects that can be represented in a such way. One of the most simple usage for the infographics, in business diagrams. Sales staff can use it as an effective method of sharing the sales results with the entire team and stakeholders. ConceptDraw Data-driven Infographics solution gives all the tools one need to present a certain type of data. ConceptDraw PRO allows you to easily create data-driven infographics and then insert them into a MS Word document.Technical Flow Chart Example
What illustrates a technical flow chart? Technical flow chart is a diagrammatic representation which visually illustrates the sequence of operations that must to be performed to get the problem's solution. ConceptDraw PRO enhanced with Flowcharts Solution from the "What is a Diagram" Area of ConceptDraw Solution is a perfect software for drawing Technical Flow Chart Example illustrating the essence and importance of the technical flow chart use.Social Media Marketing Infographic
How to create Social Media Marketing Infographic? It’s very easy! All that you need is a powerful marketing infographics software. Never before creation of Social Media Marketing Infographic wasn’t so easy as now with tools of Marketing Infographics Solution from the Business Infographics Area for ConceptDraw Solution Park.How tо Represent Information Graphically
ConceptDraw Infographics is a great visual tool for communicating the large amounts of data and graphic visualization and representations of data and information.Spatial Data Analysis
ConceptDraw PRO diagramming and vector drawing software extended with Pictorial Infographics Solution from the “What are Infographics” Area is the best for Spatial Data Analysis. You have a perfect possibility to make sure this right now.HelpDesk
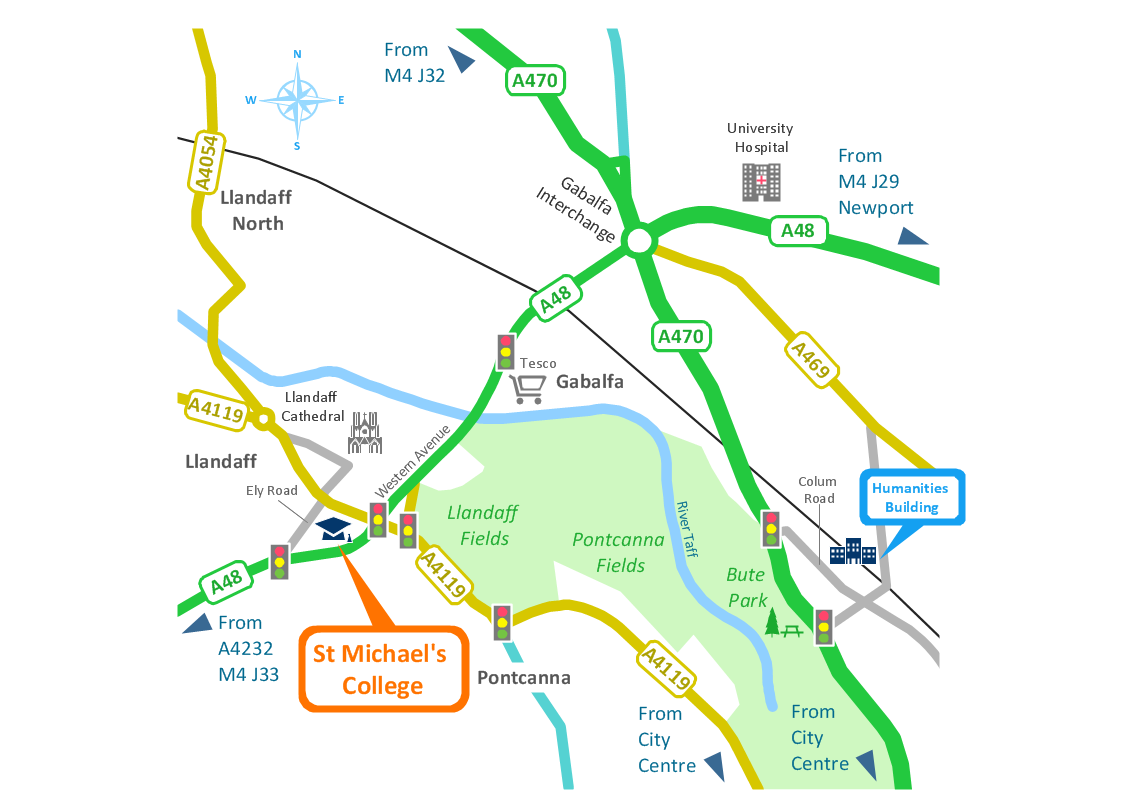
How to Create Infographics Using the Spatial Infographics Solution
Tips on how to use ConceptDraw Spatial Infographics Solution. Now you got the tool for quick and easy drawing and presenting of your own simple Spatial Infographics documents.HelpDesk
Flowchart Software Free Download
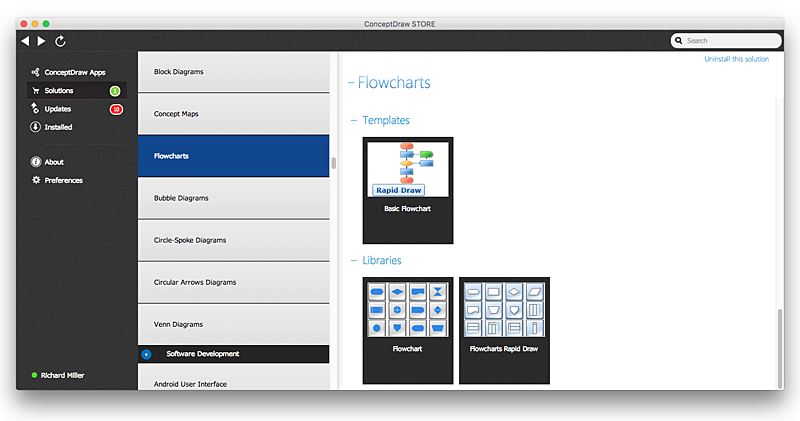
Making flowchart is an easiest way to depict any typical process. Any complex process, consisting from standard components can be displayed as a Flowchart. ConceptDraw PRO is proved to be a simple and easy tool for creating flowcharts. It does not require the skills of a professional designer. Making flowchart to map any process you will see the ways of its optimization and improvement. Flowchart software is here and you can download it for free.- Work Flow Charts For Customer Service Officer
- Business people - Vector stencils library | Process Flowchart | Boss ...
- HR department - Vector stencils library | Flow chart Example ...
- HR department - Vector stencils library | Sales department - Vector ...
- Office pictograms - Vector stencils library | Office pictograms - Vector ...
- Ecology pictograms - Vector stencils library | Ecology pictograms ...
- Sales Process Flowchart . Flowchart Examples | Competitor Analysis ...
- Hr Development Process Infographic
- HR Flowchart Symbols | Ecology pictograms - Vector stencils library ...
- Road Transport - Design Elements | Spatial infographics Design ...
- Electronic human resources (E-HR) | Types of Flowchart - Overview ...
- Flow chart Example. Warehouse Flowchart | Infographic Generator ...
- Customer Pictogram
- Accounting flowcharts - Vector stencils library | Management ...
- Subway Train Map | How to draw Metro Map style infographics ...
- Business people pictograms - Vector stencils library | Business ...
- HR Flowchart Symbols | HR symbols - Vector stencils library ...
- After Sales Service Vector
- Map symbols - Vector stencils library | How to Create Flowchart ...
- Accounting Flowchart Purchasing Receiving Payable and Payment ...


