"Customer satisfaction is a term frequently used in marketing. It is a measure of how products and services supplied by a company meet or surpass customer expectation. Customer satisfaction is defined as "the number of customers, or percentage of total customers, whose reported experience with a firm, its products, or its services (ratings) exceeds specified satisfaction goals." ...
It is seen as a key performance indicator within business and is often part of a Balanced Scorecard. In a competitive marketplace where businesses compete for customers, customer satisfaction is seen as a key differentiator and increasingly has become a key element of business strategy." [Customer satisfaction. Wikipedia]
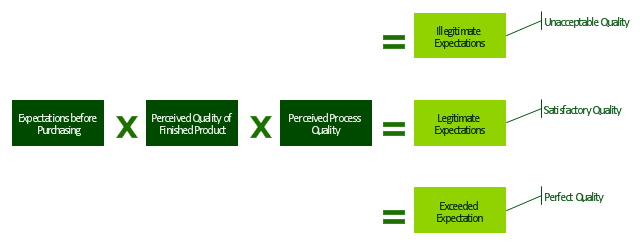
The block diagram example "Sources of customer satisfaction" was created using the ConceptDraw PRO diagramming and vector drawing software extended with the Block Diagrams solution from the area "What is a Diagram" of ConceptDraw Solution Park.
It is seen as a key performance indicator within business and is often part of a Balanced Scorecard. In a competitive marketplace where businesses compete for customers, customer satisfaction is seen as a key differentiator and increasingly has become a key element of business strategy." [Customer satisfaction. Wikipedia]
The block diagram example "Sources of customer satisfaction" was created using the ConceptDraw PRO diagramming and vector drawing software extended with the Block Diagrams solution from the area "What is a Diagram" of ConceptDraw Solution Park.
Block diagram
This ring chart sample was redesigned from the Wikipedia file: Virtuous circle in management.svg.
"An example of the use of a virtuous circle in management."
[en.wikipedia.org/ wiki/ File:Virtuous_ circle_ in_ management.svg]
"A virtuous circle and a vicious circle (also referred to as virtuous cycle and vicious cycle) are economic terms. They refer to a complex chain of events that reinforces itself through a feedback loop. A virtuous circle has favorable results, while a vicious circle has detrimental results.
Both circles are complexes of events with no tendency towards equilibrium (at least in the short run). Both systems of events have feedback loops in which each iteration of the cycle reinforces the previous one (positive feedback). These cycles will continue in the direction of their momentum until an external factor intervenes and breaks the cycle. The prefix "hyper-" is sometimes used to describe these cycles if they are extreme. The best-known example of a vicious circle is hyperinflation. ...
Example in management.
Virtuous circle.
An employer's investment in his employees’ ability to provide superior service to customers can be seen as a virtuous circle. Effort spent in selecting and training employees and creating a corporate culture in which they are empowered can lead to increased employee satisfaction and employee competence. This can result in superior service delivery and customer satisfaction. This in turn will create customer loyalty, improved sales levels, and higher profit margins. Some of these profits can be reinvested in employee development, thereby initiating another iteration of a virtuous cycle." [en.wikipedia.org/ wiki/ Virtuous_ circle_ and_ vicious_ circle]
The ring chart example "Virtuous circle (management)" was created using the ConceptDraw PRO diagramming and vector drawing software extended with the Target and Circular Diagrams solution from the Marketing area of ConceptDraw Solution Park.
www.conceptdraw.com/ solution-park/ marketing-target-and-circular-diagrams
Ring chart
---ring-chart.png--diagram-flowchart-example.png)
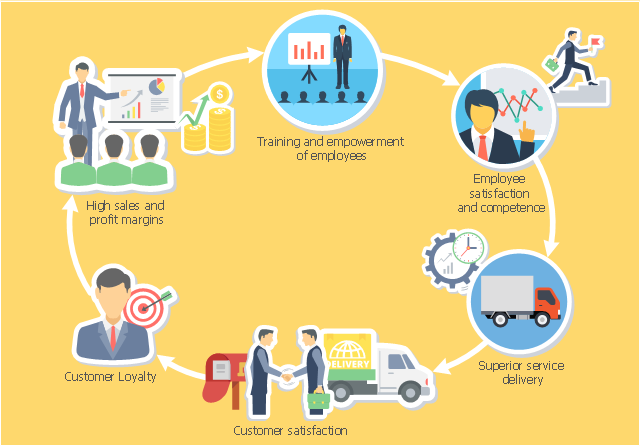
This business infographic sample shows the use of a virtuous circle in management. It was designed on the base of the Wikimedia Commons file: Virtuous circle in management.svg. [commons.wikimedia.org/ wiki/ File:Virtuous_ circle_ in_ management.svg]
"Increased customer retention and loyalty makes the employees' jobs easier and more satisfying. In turn, happy employees feed back into higher customer satisfaction in a virtuous circle." [Loyalty business model. Wikipedia]
The business infographic example "Virtuous circle in management" was designed using ConceptDraw PRO diagramming and vector drawing software extended with the Business and Finance solution from Illustration area of ConceptDraw Solution Park.
Infographic
Best Value — Total Quality Management
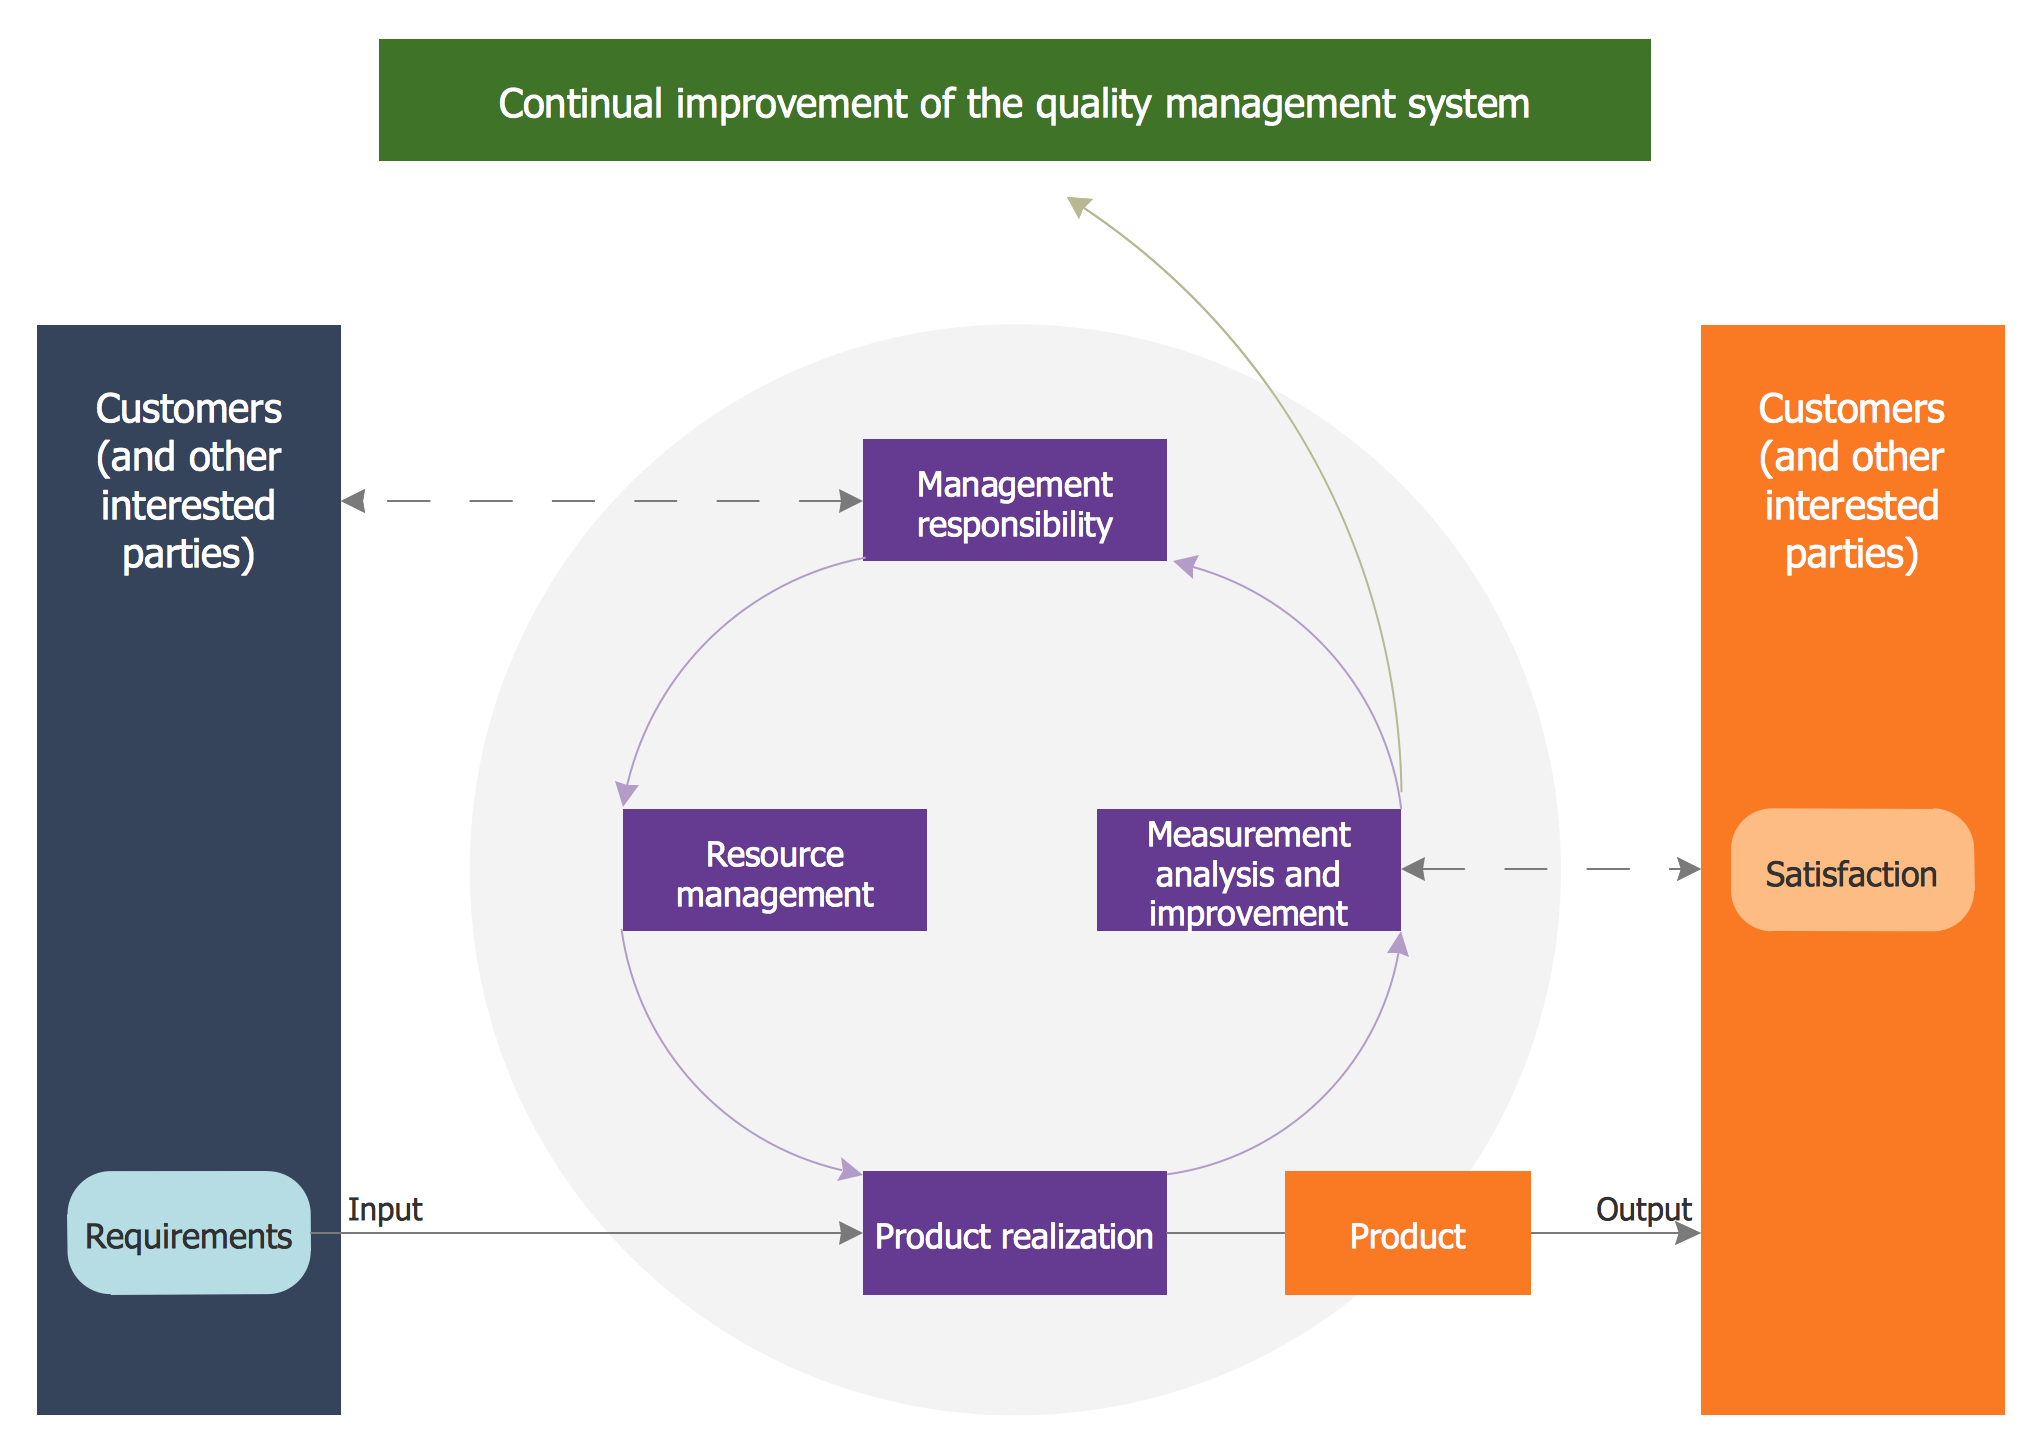
Quality Management System
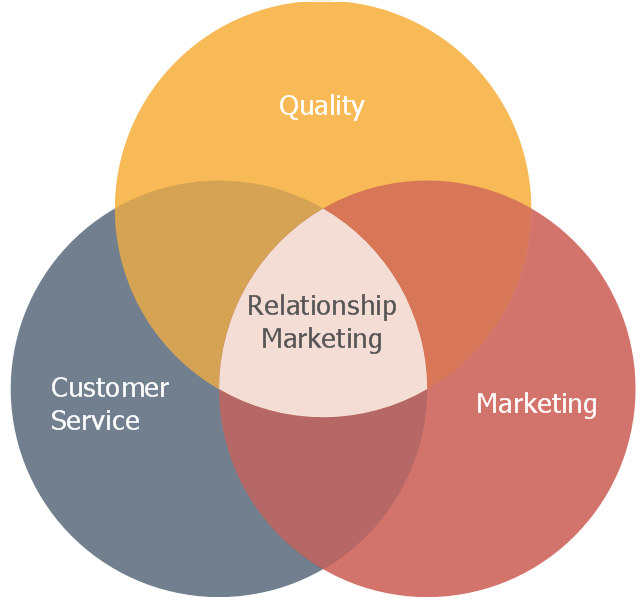
This Venn diagram sample illustrates the relationship marketing.
"Relationship marketing was first defined as a form of marketing developed from direct response marketing campaigns which emphasizes customer retention and satisfaction, rather than a dominant focus on sales transactions.
As a practice, relationship marketing differs from other forms of marketing in that it recognizes the long term value of customer relationships and extends communication beyond intrusive advertising and sales promotional messages.
With the growth of the internet and mobile platforms, relationship marketing has continued to evolve and move forward as technology opens more collaborative and social communication channels. This includes tools for managing relationships with customers that goes beyond simple demographic and customer service data. Relationship marketing extends to include inbound marketing efforts, (a combination of search optimization and strategic content), PR, social media and application development." [Relationship marketing. Wikipedia]
The Venn diagram example "Relationship marketing" was created using the ConceptDraw PRO diagramming and vector drawing software extended with the Venn Diagrams solution from the area "What is a Diagram" of ConceptDraw Solution Park.
Venn diagram
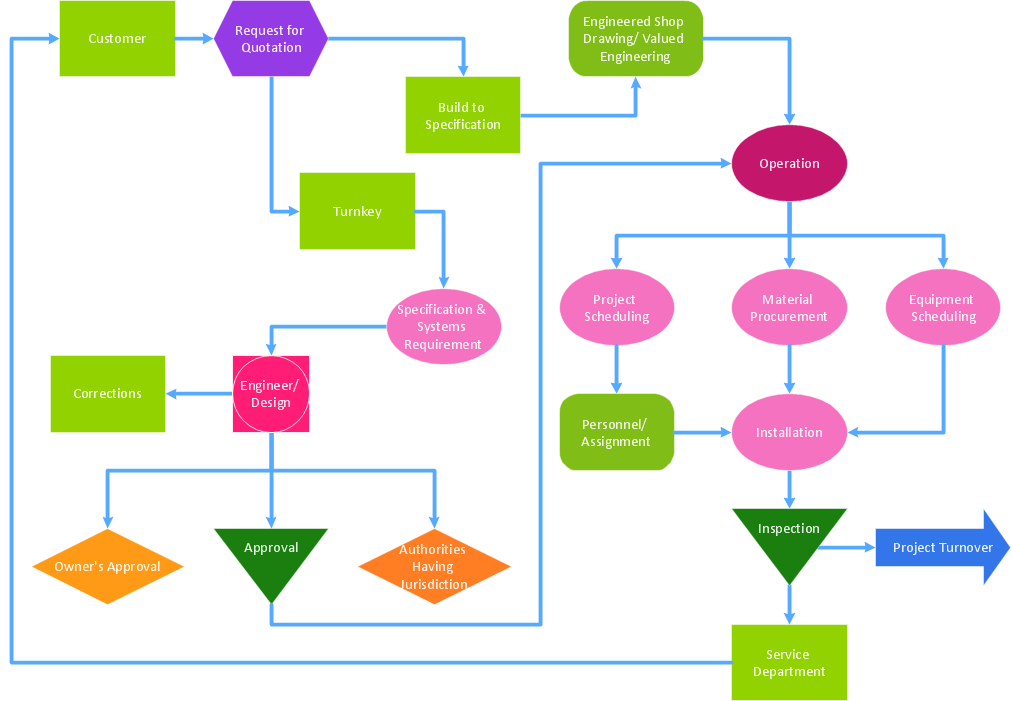
Work Order Process Flowchart. Business Process Mapping Examples

- Customer Satisfaction Wiki
- Block diagram - Sources of customer satisfaction | Marketing ...
- Block diagram - Sources of customer satisfaction | Block Diagram ...
- Electrical Symbols, Electrical Diagram Symbols | Gap Model Wiki
- Customer types matrix | Block diagram - Sources of customer ...
- Droughnut Chart Wikipedia
- Ivr System Wiki
- Block diagram - Gap model of service quality | Parasuraman Wikipedia
- Doughnut Chart Wiki