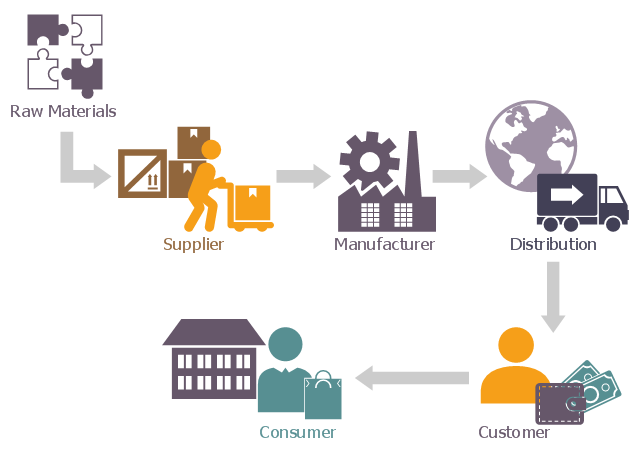
This basic diagram of supply chain network showing the movement of goods from the raw materials stage into the hands of the end consumer.
It was designed on the base of the Wikimedia Commons file: Supply chain network.png. [commons.wikimedia.org/ wiki/ File:Supply_ chain_ network.png]
This file is licensed under the Creative Commons Attribution-Share Alike 4.0 International license. [creativecommons.org/ licenses/ by-sa/ 4.0/ deed.en]
"A supply chain is a system of activities involved in handling, distributing, manufacturing and processing goods in order to move resources from a vendor into the hands of the final consumer. A supply chain is a complex network of interconnected players governed by supply and demand." [Supply chain attack. Wikipedia]
The logistic flowchart example "Supply chain network" was created using ConceptDraw PRO diagramming and vector drawing software extended with the Logistics Flow Charts solution from the Business Processes area of ConceptDraw Solution Park.
Logistic flowchart
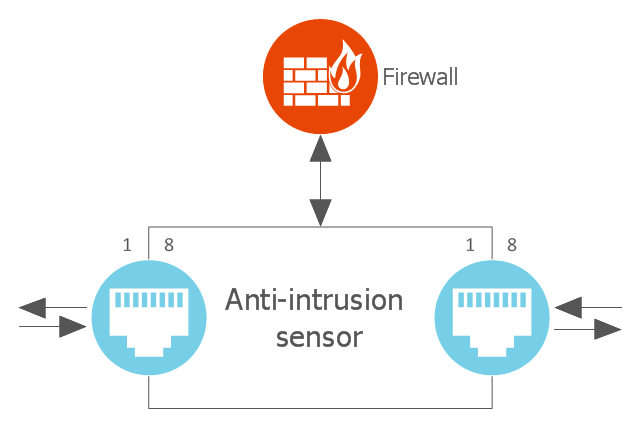
This cloud computing diagram example was drawn on the base of Wikimedia Commons file: ArchitectureptSonde.png.
"Figure representing the architecture of an anti-intrusion sensor for cloud computing." [commons.wikimedia.org/ wiki/ File:ArchitectureptSonde.png]
This file is made available under the Creative Commons CC0 1.0 Universal Public Domain Dedication. [creativecommons.org/ publicdomain/ zero/ 1.0/ deed.en]
"A wireless sensor network (WSN) (sometimes called a wireless sensor and actuator network (WSAN)) are spatially distributed autonomous sensors to monitor physical or environmental conditions, such as temperature, sound, pressure, etc. and to cooperatively pass their data through the network to a main location. The more modern networks are bi-directional, also enabling control of sensor activity. The development of wireless sensor networks was motivated by military applications such as battlefield surveillance; today such networks are used in many industrial and consumer applications, such as industrial process monitoring and control, machine health monitoring, and so on." [Wireless sensor network. Wikipedia]
The cloud computing diagram example "Anti-intrusion sensor architecture" was drawn using ConceptDraw PRO software extended with the Cloud Computing Diagrams solution from the Computer and Networks area of ConceptDraw Solution Park.
Cloud computing diagram
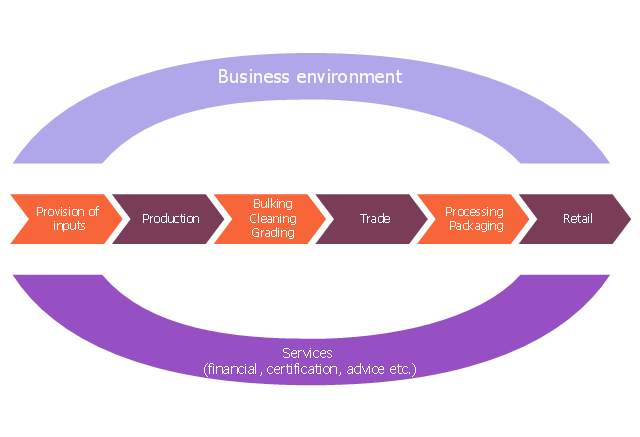
This value chain analysis diagram example illustrates value chain analysis. It was designed on the base of the Wikimedia Commons file: Typical-value-Chain.png. "Typical value chain of agricultural commodities. Belongs to The Organic Business Guide." [commons.wikimedia.org/ wiki/ File:Typical-value-Chain.png]
This file is licensed under the Creative Commons Attribution-Share Alike 3.0 Unported license. [creativecommons.org/ licenses/ by-sa/ 3.0/ deed.en]
"The agricultural value chain concept has been used since the beginning of the millennium, primarily by those working in agricultural development in developing countries. Although there is no universally accepted definition of the term, it normally refers to the whole range of goods and services necessary for an agricultural product to move from the farm to the final customer or consumer." [Agricultural value chain. Wikipedia]
The marketing chart example "Value chain analysis diagram" was created using the ConceptDraw PRO diagramming and vector drawing software extended with the Marketing Diagrams solution from the Marketing area of ConceptDraw Solution Park.
Marketing chart
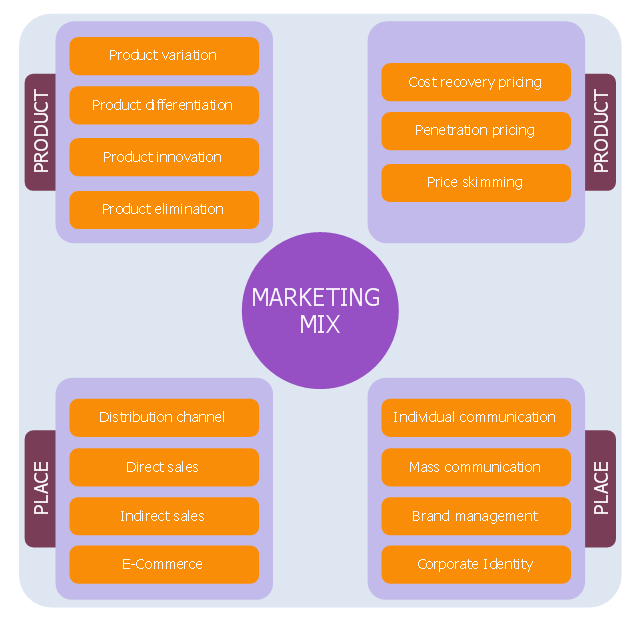
This diagram sample depicts marketing mix. It was designed on the base of the Wikimedia Commons file: Marketing-Mix (en).png.
[commons.wikimedia.org/ wiki/ File:Marketing-Mix_ %28en%29.png]
"The marketing mix is a business tool used in marketing and by marketeers . The marketing mix is often crucial when determining a product or brand's offer, and is often associated with the four P's: price, product, promotion, and place. In service marketing, however, the four Ps are expanded to the seven P's or eight P's to address the different nature of services.
In the 1990s, the concept of four C's was introduced as a more customer-driven replacement of four P's. There are two theories based on four Cs: Lauterborn's four Cs (consumer, cost, communication, convenience), and Shimizu's four Cs (commodity, cost, communication, channel).
In 2012, a new four P's theory was proposed with people, processes, programs, and performance." [Marketing mix. Wikipedia]
The chart example "Marketing mix diagram" was created using the ConceptDraw PRO diagramming and vector drawing software extended with the Marketing Diagrams solution from the Marketing area of ConceptDraw Solution Park.
Chart example
 Customer Journey Mapping
Customer Journey Mapping Solution for ConceptDraw DIAGRAM opens incredibly broad opportunities for marketing and business specialists, product managers, designers, engineers, and other people interested in business development, increasing the product’s audience, its success and users' demand, providing them with capabilities of customer journey mapping. The included diagramming and customer journey mapping tools, predesigned vector customer journey mapping icons and charts, consumer journey mapping connectors, user journey and customer mapping figures, customer experience map icons and touchpoint icons, quick-start templates and samples provide excellent conditions for the customer journey mapping process, for creating Customer Journey Map and Customer Experience Map.
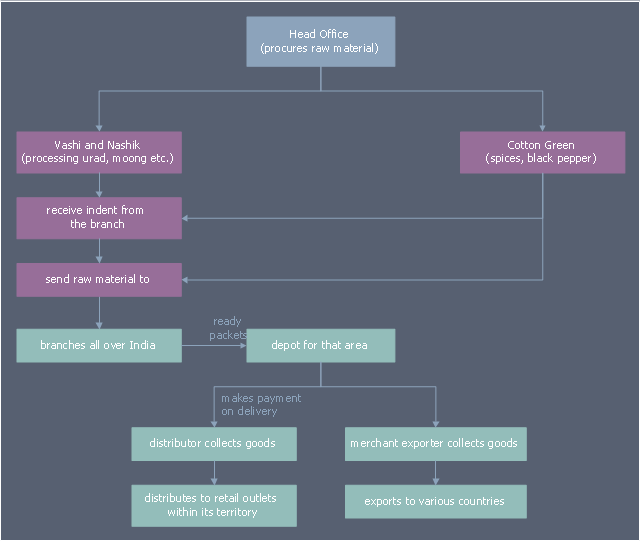
This business process flowchart example was redesigned from the Wikimedia Commons file: SMGULP-distribution-flowchart.png.
[commons.wikimedia.org/ wiki/ File:SMGULP-distribution-flowchart.png]
"Shri Mahila Griha Udyog Lijjat Papad, popularly known as Lijjat, is an Indian women's cooperative involved in manufacturing of various fast moving consumer goods." [Shri Mahila Griha Udyog Lijjat Papad. Wikipedia]
The business process map example "Distribution flowchart example" was drawn using the ConceptDraw PRO diagramming and business graphics software extended with the Business Process Mapping solution from the Business Processes area of ConceptDraw Solution Park.
Business process map
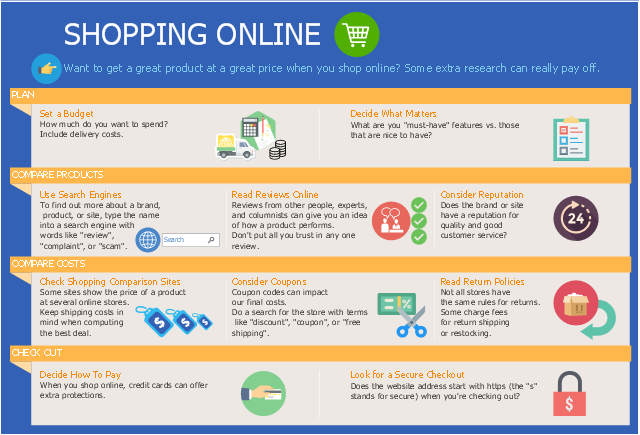
This business infographic sample shows how to get a great product at a great price when you shop online. It was designed on the base of the infographic "Shopping Online" from the Consumer Information website of the U.S. Federal Trade Commission. [consumer.ftc.gov/ sites/ default/ files/ pictures/ 0041-shopping-online-infographic.png]
"Online shopping (sometimes known as e-tail from "electronic retail" or e-shopping) is a form of electronic commerce which allows consumers to directly buy goods or services from a seller over the Internet using a web browser. Alternative names are: e-web-store, e-shop, e-store, Internet shop, web-shop, web-store, online store, online storefront and virtual store. Mobile commerce (or m-commerce) describes purchasing from an online retailer's mobile optimized online site or app." [Online shopping. Wikipedia]
The business infographic example "Shopping Online" was designed using ConceptDraw PRO diagramming and vector drawing software extended with the Business and Finance solution from Illustration area of ConceptDraw Solution Park.
Infographic
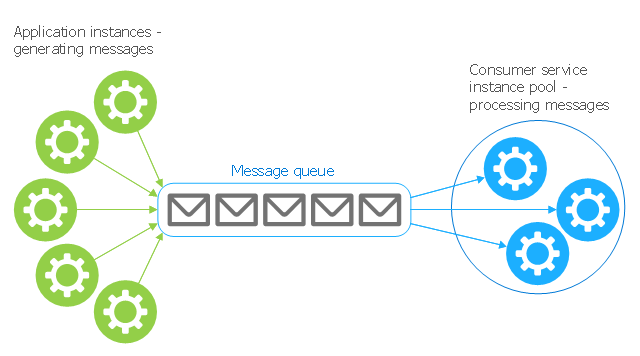
This Azure cloud architecture pattern diagram template was created on the base of figure in the article "Competing Consumers Pattern" from the Microsoft Developer Network (MSDN) website.
"Competing Consumers Pattern.
Enable multiple concurrent consumers to process messages received on the same messaging channel. This pattern enables a system to process multiple messages concurrently to optimize throughput, to improve scalability and availability, and to balance the workload. ...
An application running in the cloud may be expected to handle a large number of requests. Rather than process each request synchronously, a common technique is for the application to pass them through a messaging system to another service (a consumer service) that handles them asynchronously. This strategy helps to ensure that the business logic in the application is not blocked while the requests are being processed. ...
Use a message queue to implement the communication channel between the application and the instances of the consumer service. The application posts requests in the form of messages to the queue, and the consumer service instances receive messages from the queue and process them. This approach enables the same pool of consumer service instances to handle messages from any instance of the application." [msdn.microsoft.com/ ru-RU/ library/ dn568101.aspx]
The Azure cloud system architecture diagram template "Competing consumers pattern" for the ConceptDraw PRO diagramming and vector drawing software is included in the Azure Architecture solutin from the Computer and Networks area of ConceptDraw Solution Park.
Cloud computing system architecture diagram template
This exploded pie chart sample shows the economic sector weightings. It was designed on the base of the Wikimedia Commons file: Badpie.png [commons.wikimedia.org/ wiki/ File:Badpie.png].
This image is available under the Creative Commons Attribution-ShareAlike 3.0 Unported License [creativecommons.org/ licenses/ by-sa/ 3.0/ ].
"The classical breakdown of all economic sectors follows:
Primary: Involves the retrieval and production of raw materials, such as corn, coal, wood and iron. (A coal miner and a fisherman would be workers in the primary sector.)
Secondary: Involves the transformation of raw or intermediate materials into goods e.g. manufacturing steel into cars, or textiles into clothing. (A builder and a dressmaker would be workers in the secondary sector.)
Tertiary: Involves the supplying of services to consumers and businesses, such as baby-sitting, cinema and banking. (A shopkeeper and an accountant would be workers in the tertiary sector.)
In the 20th century, it began to be argued that traditional tertiary services could be further distinguished from "quaternary" and quinary service sectors." [Economic sector. Wikipedia]
The exploded pie chart example "Economic sector weightings" was created using the ConceptDraw PRO diagramming and vector drawing software extended with the Pie Charts solution of the Graphs and Charts area in ConceptDraw Solution Park.
Exploded pie chart

Flowchart design. Flowchart symbols, shapes, stencils and icons

