HelpDesk
How to Create an IDEF0 Diagram for an Application Development
IDEF0 methods are intended to model the functions of a process, creating a graphical model that displays: what controls the function, who makes it, what resources are used and how they are connected with other functions. The IDEF0 tool is used to model the decisions, actions, and activities of a software system during the development process . IDEF0 diagram graphically depicts a model of a desired version of the application. ConceptDraw PRO allows you to create and communicate the IDEF0 diagrams of any complexity.
 Entity-Relationship Diagram (ERD)
Entity-Relationship Diagram (ERD) solution extends ConceptDraw PRO software with templates, samples and libraries of vector stencils from drawing the ER-diagrams by Chen's and crow’s foot notations.
HelpDesk
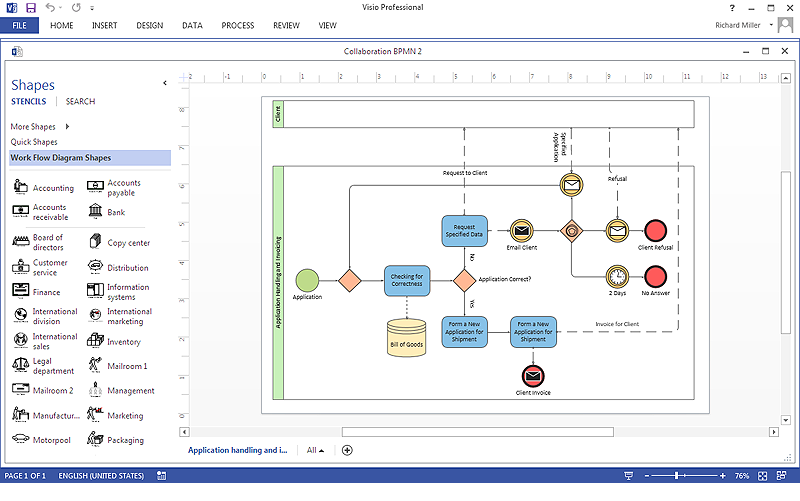
How To Create a MS Visio Business Process Diagram
Business process diagrams are specialized types of flowcharts based on the Business Process Model and Notation. The BPMN specification describes the symbols to display business processes in the form of business process diagrams. The main objective of BPMN is to create a standard set of symbols that are understandable to all business users, such as business analysts who create and improve processes, technical developers responsible for implementing processes and managers who take care processes and control them. Making a business process diagram involves many different elements that can be managed using ConceptDraw PRO. The ability to design Business process diagrams is delivered by the Business Process Diagrams solution. ConceptDraw PRO supports export of business process diagrams to MS Visio files. Thus, you can share your business documentation with MS Visio users.Process Flowchart
The main reason of using Process Flowchart or PFD is to show relations between major parts of the system. Process Flowcharts are used in process engineering and chemical industry where there is a requirement of depicting relationships between major components only and not include minor parts. Process Flowcharts for single unit or multiple units differ in their structure and implementation. ConceptDraw PRO is Professional business process mapping software for making Process flowcharts, Process flow diagram, Workflow diagram, flowcharts and technical illustrations for business documents and also comprehensive visio for mac application. Easier define and document basic work and data flows, financial, production and quality management processes to increase efficiency of your business with ConcepDraw PRO. Business process mapping software with Flowchart Maker ConceptDraw PRO includes extensive drawing tools, rich examples and templates, process flowchart symbols and shape libraries, smart connectors that allow you create the flowcharts of complex processes, process flow diagrams, procedures and information exchange. Process Flowchart Solution is project management workflow tools which is part ConceptDraw Project marketing project management software. Drawing charts, diagrams, and network layouts has long been the monopoly of Microsoft Visio, making Mac users to struggle when needing such visio alternative like visio for mac, it requires only to view features, make a minor edit to, or print a diagram or chart. Thankfully to MS Visio alternative like ConceptDraw PRO software, this is cross-platform charting and business process management tool, now visio alternative for making sort of visio diagram is not a problem anymore however many people still name it business process visio tools.
HelpDesk
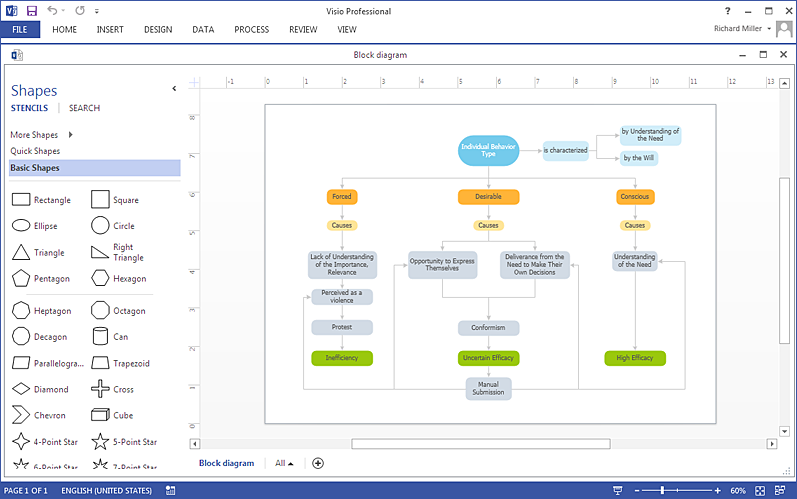
How To Create MS Visio Block Diagram
ConceptDraw PRO allows you to easily create block diagrams of any complexity and then make a MS Visio file from your diagram in a single click.HelpDesk
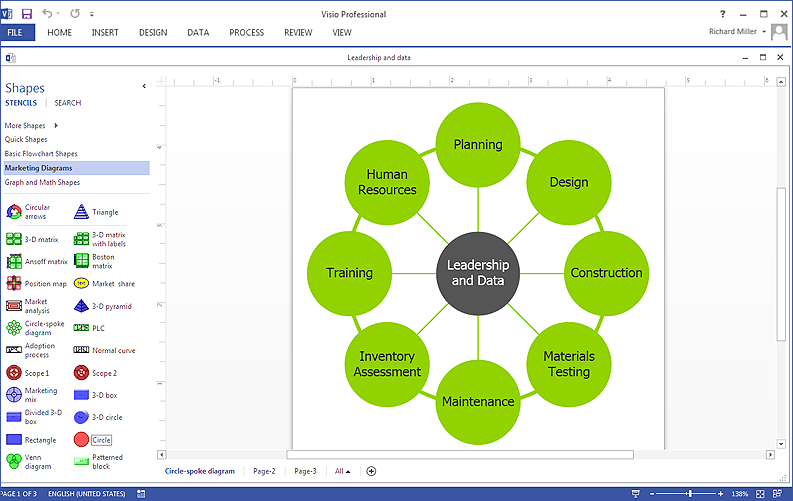
How To Make Visio Circle-Spoke Diagram
Circle Spoke Diagram consists from a central round balloon , wich is circled with other balloons as a ring . The Circle Spoke Diagram is usually used in marketing . It shows the relationships of entities and the central element. Circle Spoke Diagram can be used in marketing documentation and presentations. ConceptDraw PRO allows you to easily create marketing charts of any complexity, including the circle-spoke diagram and then make a MS Visio file from your diagram in a few simple steps. You can easily design your business documentation and share it easily with MS Visio users.HelpDesk
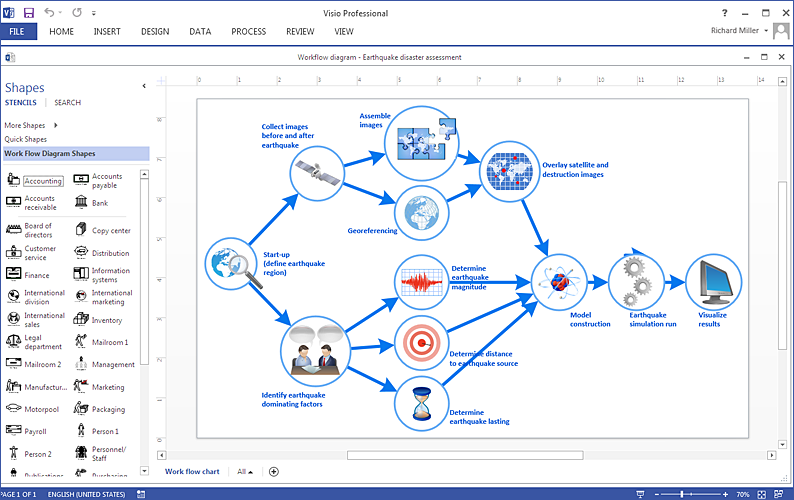
How To Create a MS Visio Workflow Diagram
A workflow diagram shows a working process as a set of related events that follow each other in a particular order.They are usually created as flowcharts, with shapes that represent steps in the process connected by arrows that indicate the next step. Making a business process diagram involves many elements that can be managed using ConceptDraw PRO. The ability to design workflow diagrams is delivered by the Workflow Diagrams solution. ConceptDraw PRO allows you to easily create workflow diagrams and then make a MS Visio file from your diagrams. Using ConceptDraw PRO, you can export your workflow diagrams to MS Visio VSDX and VDX files.HelpDesk
How To Create MS Visio Flowchart
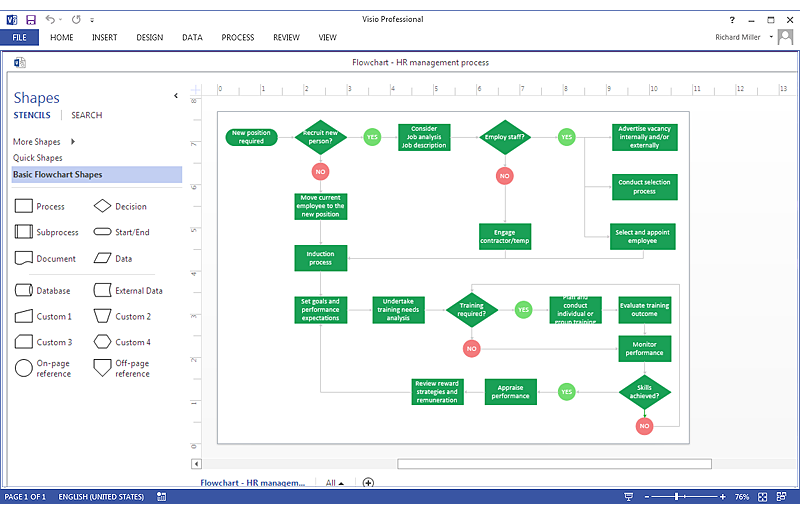
Making a process or work flow step-by-step visualization helps you to better understand it and effectively communicate with your audience. Flowcharting is the best way to do this. Flowchart is a diagram that successively depicts all process steps. Basic flowchart is the most easy and understandable type of a flowchart. Using ConceptDraw PRO you can design flowcharts of any complexity on Windows or OS X . Then you can export them to Visio format to share with the users of MS Visio. Moreover, using ConceptDraw PRO you can open and edit a flowchart made in Visio, regardless of whether you are using OS X or Windows.
 Event-driven Process Chain Diagrams
Event-driven Process Chain (EPC) Diagram is a type of flowchart widely used for modeling in business engineering and reengineering, business process improvement, and analysis. EPC method was developed within the Architecture of Integrated Information Systems (ARIS) framework.
ConceptDraw PRO Database Modeling Software
ConceptDraw PRO is a very easy-to-use and intuitive database design tool which can save you hundreds of work hours. See database diagram samples created with ConceptDraw PRO database modeling database diagram software.HelpDesk
How to Create a Timeline Diagram in ConceptDraw PRO
A Timeline is a chart which displays a project plan schedule in chronological order. A Timeline is used in project management to depict project milestones and visualize project phases, and show project progress. The graphic form of a timeline makes it easy to understand critical project milestones, such as the progress of a project schedule. Timelines are particularly useful for project scheduling or project management when accompanied with a Gantt chart. It captures the main of what the project will accomplish and how it will be done. making a project timeline is one of the most important skills a project manager needs have. Making comprehensive, accurate timelines allows you getting every project off in the best way. ConceptDraw PRO allows you to draw a timeline charts using special library.
 Pyramid Diagrams
Pyramid Diagrams solution extends ConceptDraw PRO software with templates, samples and library of vector stencils for drawing the marketing pyramid diagrams.
Basic Flowchart Symbols and Meaning
Flowcharts are the best for visually representation the business processes and the flow of a custom-order process through various departments within an organization. ConceptDraw PRO diagramming and vector drawing software extended with Flowcharts solution offers the full set of predesigned basic flowchart symbols which are gathered at two libraries: Flowchart and Flowcharts Rapid Draw. Among them are: process, terminator, decision, data, document, display, manual loop, and many other specific symbols. The meaning for each symbol offered by ConceptDraw gives the presentation about their proposed use in professional Flowcharts for business and technical processes, software algorithms, well-developed structures of web sites, Workflow diagrams, Process flow diagram and correlation in developing on-line instructional projects or business process system. Use of ready flow chart symbols in diagrams is incredibly useful - you need simply drag desired from the libraries to your document and arrange them in required order. There are a few serious alternatives to Visio for Mac, one of them is ConceptDraw PRO. It is one of the main contender with the most similar features and capabilities.
HelpDesk
How to Draw the Different Types of Pie Charts
Using the Pie Chart, you can visually estimate the relative contribution that different data categories contribute to a whole value. The pie chart displays the statistics in a visual format. The main use of pie charts to show comparisons. The larger piece of the pie, the more the value of this value compared to the rest. Various applications of pie charts can be found in business and education. For business, pie charts can be used to compare the success or failure of the goods or services. They may also be used to display the business market share.Model Based Systems Engineering
ConceptDraw PRO is a professional diagramming and vector drawing software. Now, enhanced with SysML Solution from the Software Development Area of ConceptDraw Solution Park, ConceptDraw PRO became an ideal software for model based systems engineering (MBSE).- Data Flow Diagrams | Process Flowchart | Visio Files and ...
- Databases Access Objects Model with ConceptDraw PRO | IDEF0 ...
- Program Structure Diagram | Databases Access Objects Model with ...
- Design elements - ERD (crow's foot notation) | Entity Relationship ...
- ConceptDraw PRO Compatibility with MS Visio | Process Flowchart ...
- How To Create a MS Visio Business Process Diagram Using ...
- IDEF0 Diagrams | Process Flowchart | IDEF0 Visio | Drawing The ...
- UML Diagram Visio | MS Visio Look a Like Diagrams | UML ...
- ConceptDraw PRO Compatibility with MS Visio | Electrical Diagram ...
- ConceptDraw PRO Compatibility with MS Visio | Visio Files and ...
- In searching of alternative to MS Visio for MAC and PC with ...
- How to Open MS Visio ® 2013/2016 Files on a Mac® Using ...
- Microsoft Visio Vector Notations
- In searching of alternative to MS Visio for MAC and PC with ...
- How to Convert a Visio Stencils for Use in ConceptDraw PRO ...
- ConceptDraw PRO Compatibility with MS Visio | In searching of ...
- How to Open MS Visio ® 2013/2016 Files on a Mac® Using ...
- ConceptDraw PRO Compatibility with MS Visio | IDEF0 Visio | How ...
- ConceptDraw PRO Compatibility with MS Visio | Software ...
- ConceptDraw PRO Compatibility with MS Visio | In searching of ...

