This circle diagram sample was redesigned from the Wikimedia Commons file: Research cycle.png. "Some of the basic elements of the scientific method, arranged in a cycle to emphasize that it is an iterative process." [commons.wikimedia.org/ wiki/ File:Research_ cycle.png]
This file is licensed under the Creative Commons Attribution 2.0 Generic license. [creativecommons.org/ licenses/ by/ 2.0/ deed.en]
"The scientific method is a body of techniques for investigating phenomena, acquiring new knowledge, or correcting and integrating previous knowledge. To be termed scientific, a method of inquiry must be based on empirical and measurable evidence subject to specific principles of reasoning. ...
Four essential elements of the scientific method are iterations, recursions, interleavings, or orderings of the following:
(1) Characterizations (observations, definitions, and measurements of the subject of inquiry).
(2) Hypotheses (theoretical, hypothetical explanations of observations and measurements of the subject).
(3) Predictions (reasoning including logical deduction from the hypothesis or theory).
(4) Experiments (tests of all of the above)...
A linearized, pragmatic scheme of the four points above is sometimes offered as a guideline for proceeding:
(1) Define a question.
(2) Gather information and resources (observe).
(3) Form an explanatory hypothesis.
(4) Test the hypothesis by performing an experiment and collecting data in a reproducible manner.
(5) Analyze the data.
(6) Interpret the data and draw conclusions that serve as a starting point for new hypothesis.
(7) Publish results.
(8) Retest (frequently done by other scientists).
The iterative cycle inherent in this step-by-step method goes from point 3 to 6 back to 3 again." [Scientific method. Wikipedia]
The circle diagram example "Research cycle" was created using the ConceptDraw PRO diagramming and vector drawing software extended with the Target and Circular Diagrams solution from the Marketing area of ConceptDraw Solution Park.
www.conceptdraw.com/ solution-park/ marketing-target-and-circular-diagrams
Circle diagram

This circular arrows diagram sample depicts the Plan–Do–Check–Act cycle.
"PDCA (plan–do–check–act or plan–do–check–adjust) is an iterative four-step management method used in business for the control and continuous improvement of processes and products. It is also known as the Deming circle/ cycle/ wheel, Shewhart cycle, control circle/ cycle, or plan–do–study–act (PDSA). Another version of this PDCA cycle is OPDCA. The added "O" stands for observation or as some versions say "Grasp the current condition." This emphasis on observation and current condition has currency with Lean manufacturing/ Toyota Production System literature." [PDCA. Wikipedia]
The diagram example "PDCA cycle" was created using the ConceptDraw PRO diagramming and vector drawing software extended with the Circular Arrows Diagrams solution from the area "What is a Diagram" of ConceptDraw Solution Park.
Circular arrows diagram

 Education Package
Education Package is a comprehensive set of multifarious graphical solutions from ConceptDraw Solution Park, collected together in help to ConceptDraw PRO users working in a field of science, education and training, which is aimed at improving the quality of education and helping to design with ease variety of interesting and colorful educational materials, diagrams, charts and maps. Use it to present the information and knowledge in an interesting, clear, structured and simple form to achieve a success in education and pedagogy, to maintain the interest of students and pupils throughout the whole learning process, at the lectures, lessons and even during independent work with additional materials, to contribute to better perception of scientific information by listeners during the conferences and reports.
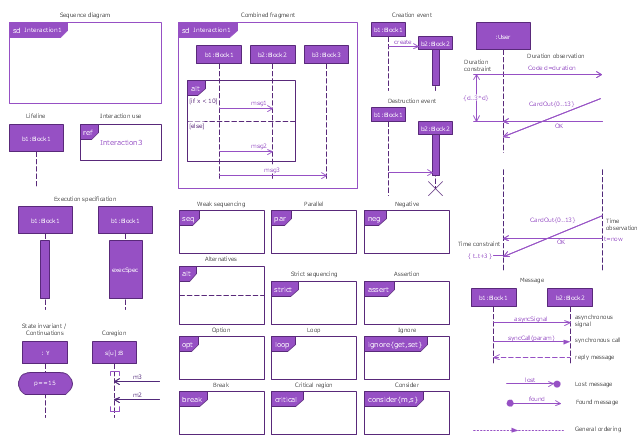
The vector stencils library "Sequence diagram" contains 32 SysML symbols.
Use it to design your sequence diagrams using ConceptDraw PRO diagramming and vector drawing software.
"A sequence diagram shows, as parallel vertical lines (lifelines), different processes or objects that live simultaneously, and, as horizontal arrows, the messages exchanged between them, in the order in which they occur. This allows the specification of simple runtime scenarios in a graphical manner. ...
If the lifeline is that of an object, it demonstrates a role. Leaving the instance name blank can represent anonymous and unnamed instances.
Messages, written with horizontal arrows with the message name written above them, display interaction. Solid arrow heads represent synchronous calls, open arrow heads represent asynchronous messages, and dashed lines represent reply messages. If a caller sends a synchronous message, it must wait until the message is done, such as invoking a subroutine. If a caller sends an asynchronous message, it can continue processing and doesn’t have to wait for a response. Asynchronous calls are present in multithreaded applications and in message-oriented middleware. Activation boxes, or method-call boxes, are opaque rectangles drawn on top of lifelines to represent that processes are being performed in response to the message (ExecutionSpecifications in UML).
Objects calling methods on themselves use messages and add new activation boxes on top of any others to indicate a further level of processing.
When an object is destroyed (removed from memory), an X is drawn on top of the lifeline, and the dashed line ceases to be drawn below it (this is not the case in the first example though). It should be the result of a message, either from the object itself, or another.
A message sent from outside the diagram can be represented by a message originating from a filled-in circle (found message in UML) or from a border of the sequence diagram (gate in UML)." [Sequence diagram. Wikipedia]
The SysML shapes example "Design elements - Sequence diagram" is included in the SysML solution from the Software Development area of ConceptDraw Solution Park.
SysML sequence diagram symbols
 Histograms
How to make a Histogram? Making a Histogram is an incredibly easy process when it is done with ConceptDraw PRO. The Histograms Solution enhances ConceptDraw PRO v10 functionality with extensive drawing tools, numerous samples, and examples; also a quick-start template and library of ready vector stencils for visualization the data and professional drawing Histograms.
 Basic Histograms
This solution extends the capabilities of ConceptDraw PRO v10.3.0 (or later) with templates, samples and a library of vector stencils for drawing Histograms.
 Workflow Diagrams
Workflow Diagrams solution extends ConceptDraw PRO software with samples, templates and vector stencils library for drawing the work process flowcharts.
HelpDesk
How to Draw a Histogram in ConceptDraw PRO

 SYSML
SYSML
The SysML solution helps to present diagrams using Systems Modeling Language; a perfect tool for system engineering.
 Audit Flowcharts
Audit flowcharts solution extends ConceptDraw PRO software with templates, samples and library of vector stencils for drawing the audit and fiscal flow charts.
 Education Mind Maps
This solution extends ConceptDraw MINDMAP software with scientific and educational mind maps for educational documents, presentations, and websites.
- Circle Diagrams | Research cycle - Circle diagram | Lifecycle of an ...
- Research cycle - Circle diagram | Word Exchange | The Conclusion ...
- Research cycle - Circle diagram | Innovation life cycle - Arrow loop ...
- Research cycle - Circle diagram | Export from ConceptDraw PRO ...
- Target and Circular Diagrams | Circular Arrows Diagrams ...
- Process Flowchart | Research cycle - Circle diagram | Basic ...
- Research cycle - Circle diagram | Research onion diagram ...
- Research cycle - Circle diagram | How To Create Onion Diagram ...
- Circle Diagrams | Research cycle - Circle diagram | Circle-Spoke ...
- PDCA cycle | Research cycle - Circle diagram | Life cycle of an ...
- Circle Diagram Png
- Research cycle - Circle diagram | DroidDia PRO unlocker | Porter ...
- Research cycle - Circle diagram | Business feedback loop | Life ...
- Research cycle - Circle diagram | 3 Circle Venn Diagram. Venn ...
- Research cycle - Circle diagram | Circular diagrams - Vector stencils ...
- Circle-Spoke Diagrams | Research cycle - Circle diagram | How to ...
- Leaky bucket diagram | Research cycle - Circle diagram | SWOT ...
- Business feedback loop | Research cycle - Circle diagram | Life ...
- Research cycle - Circle diagram | 2 Circle Venn Diagram. Venn ...
- Sample Circle Diagram