 Circle-Spoke Diagrams
Examples of subject areas that are well suited to this approach are marketing, business, products promotion, process modeling, market, resource, time, and cost analysis. Circle-Spoke Diagrams are successfully used in presentations, conferences, management documents, magazines, reportages, reviews, reports, TV, and social media.
HelpDesk
How to Draw a Circle-Spoke Diagram Using ConceptDraw PRO

The cycle diagram sample was created on the base of the figure illustrating the webpage "2. POLICY & STRATEGY" of "Scottish Police College Primary Inspection 2006: A Report by Her Majesty's Inspectorate of Constabulary" from the Scottish Government website.
"Strategic Planning.
2.1 The planning process for the College currently follows a structured approach, starting in April and extending through the financial year. The planning cycle is illustrated in figure 2. ...
2.2 The College recognises the need to consult with its customers and stakeholders in the process of setting objectives and directing the training programme. The planning cycle to date refers to force visits, environmental scanning, the course planning process which involves consultation with all forces and other common police services, as well as to a survey of external providers.
2.3 The information from consultation feeds into an EFQM framework from which the College has identified four key policies, namely:
(1) developing and delivering quality training;
(2) developing our people through lifelong learning;
(3) continuous improvement of our service; and
(4) embracing the changing environment.
2.4 The objectives set at divisional level are designed to contribute to delivering these policies. HMIC found that whilst the selected objectives were presented in line with the structure, not all could be considered to meet SMART (Specific, Measurable, Achievable, Relevant and Timed) criteria. This failure indicates that while the process appears suitably structured to deliver a robust result, some of those involved could perhaps have a better understanding of the process." [scotland.gov.uk/ Publications/ 2007/ 02/ 15134652/ 8]
The cycle diagram example "Strategic planning" was created using the ConceptDraw PRO diagramming and vector drawing software extended with the Target and Circular Diagrams solution from the Marketing area of ConceptDraw Solution Park.
www.conceptdraw.com/ solution-park/ marketing-target-and-circular-diagrams
Cycle diagram

The vector stencils library "Circular diagrams" contains 42 templates of circular diagrams: circular arrow diagram, circular motion diagram, arrow ring chart, doughnut chart (donut chart), circle pie chart, diamond pie chart, circle diagram, pie chart, ring chart, loop diagram, block loop diagram, arrow loop circle, crystal diagram, triangular diagram, diamond diagram, pentagon diagram, hexagon diagram, heptagon diagram, cycle diagram (cycle chart), stacked Venn diagram (onion diagram), arrow circle diagram.
Use these shapes to illustrate your marketing and sales documents, presentations, webpages and infographics in the ConceptDraw PRO diagramming and vector drawing software extended with the Target and Circular Diagrams solution from the Marketing area of ConceptDraw Solution Park.
www.conceptdraw.com/ solution-park/ marketing-target-and-circular-diagrams
Circular arrow diagram 1
Circular arrow diagram 2
Arrow ring chart
Doughnut chart

Diamond pie chart

Pie chart

Circle diagram

Circle pie chart 2

Circle pie chart 1

Ring chart 1 - 3 elements

Ring chart 1 - 4 elements

Ring chart 1 - 5 elements

Ring chart 1 - 6 elements

Ring chart 1 - 7 elements

Ring chart 2 - 3 elements

Ring chart 2 - 4 elements

Ring chart 2 - 5 elements

Ring chart 2 - 6 elements

Ring chart 2 - 7 elements

Crystal diagram - 3 elements

Crystal diagram - 4 elements

Crystal diagram - 5 elements

Crystal diagram - 6 elements

Crystal diagram - 7 elements

Stacked Venn diagram - 4

Stacked Venn diagram - 5

Stacked Venn diagram - 6

Stacked Venn diagram - 7

Basic loop diagram

Block loop diagram

Arrow loop circle
Arrow loop - 3 circles
Arrow loop - 4 circles
Arrow loop - 5 circles
Arrow loop - 6 circles
Arrow loop - 7 circles
Arrow circle diagram - 3
Arrow circle diagram - 4
Stacked Venn diagram - 3

Arrow circle diagram - 5
Arrow circle diagram - 6
Arrow circle diagram - 7
This arrow loop cycle diagram sample was created on the base of the figure illustrating the webpage "Exploratory Advanced Research Program Hand-Off Workshops" from the US Department of Transportation - Federal Highway Administration (FHWA) website. "The FHWA’s research and technology innovation life cycle illustrates that research and technology development are not insular activities, but integrated processes that together constitute a system.
Following general workshop discussion, a number of common issues emerged among the groups. These centered around the research life cycle, communicating the value of exploratory advanced research, and continued project funding. It was felt that there is a general need to better describe the research and deployment cycle specific to highway transportation and possibly to highway research fields, such as materials or system planning. Research life cycle diagrams show a very linear, chronological process but it is not necessarily that way in reality." [fhwa.dot.gov/ advancedresearch/ pubs/ 11034/ ]
The arrow loop diagram example "Innovation life cycle" was created using the ConceptDraw PRO diagramming and vector drawing software extended with the Target and Circular Diagrams solution from the Marketing area of ConceptDraw Solution Park.
www.conceptdraw.com/ solution-park/ marketing-target-and-circular-diagrams
Arrow loop cycle diagram
This Water cycle diagram example was drawn using the ConceptDraw PRO diagramming and vector graphics software extended with the clipart libraries Geography and Weather.
"The water cycle, also known as the hydrologic cycle or the H2O cycle, describes the continuous movement of water on, above and below the surface of the Earth. The mass water on Earth remains fairly constant over time but the partitioning of the water into the major reservoirs of ice, fresh water, saline water and atmospheric water is variable depending on a wide range of climatic variables. The water moves from one reservoir to another, such as from river to ocean, or from the ocean to the atmosphere, by the physical processes of evaporation, condensation, precipitation, infiltration, runoff, and subsurface flow. In so doing, the water goes through different phases: liquid, solid (ice), and gas (vapor)." [Water cycle. Wikipedia]
This water cycle diagram example is included in the Nature solution from the Illustration area of ConceptDraw Solution Park.
Vector illustration

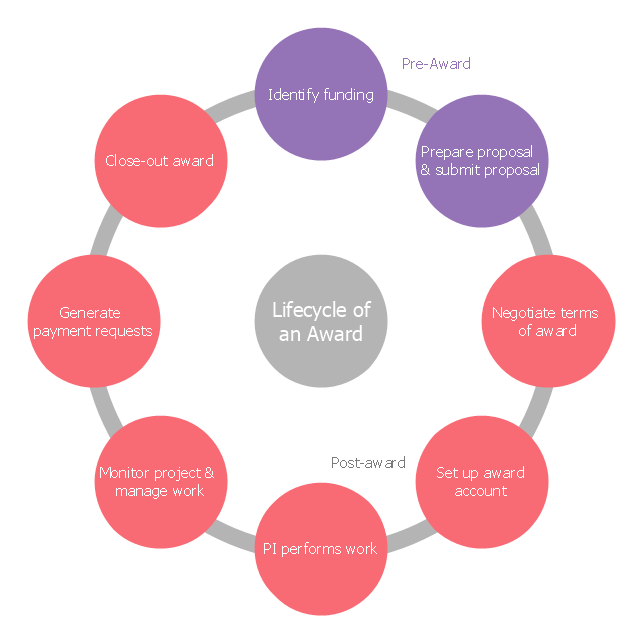
This circle diagram sample was created on the base of figure illustrating the webpage "Post-Award Process" from the Ball State University website.
[cms.bsu.edu/ about/ administrativeoffices/ contractsgrants/ postaward]
The circle diagram depicts stages of the lifecycle of an award:
(1) Identify funding.
(2) Prepare and submit proposal.
(3) Negotiate terms of award.
(4) Set up award account.
(5) PI performs work.
(6) Monitor project and manage work.
(7) Generate payment requests.
(8) Close-out award.
The circle diagram example "Lifecycle of an award" was created using the ConceptDraw PRO diagramming and vector drawing software extended with the Target and Circular Diagrams solution from the Marketing area of ConceptDraw Solution Park.
www.conceptdraw.com/ solution-park/ marketing-target-and-circular-diagrams
Circle diagram
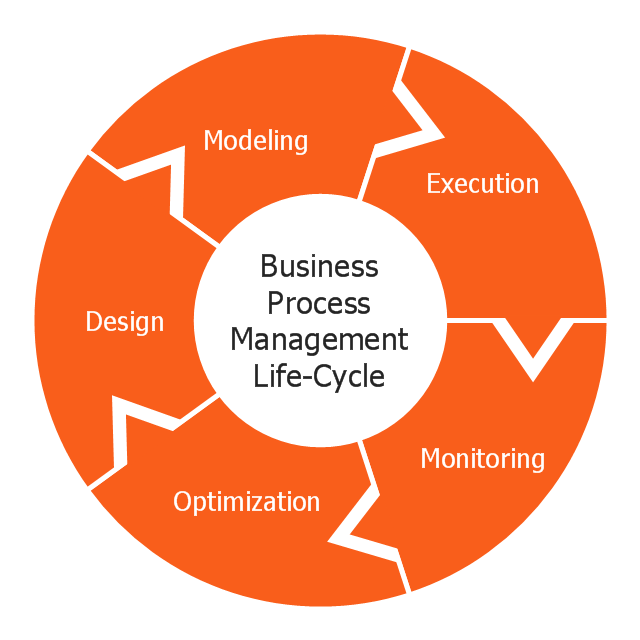
"BPM life-cycle.
Business process management activities can be grouped into six categories: vision, design, modeling, execution, monitoring, and optimization.
Functions are designed around the strategic vision and goals of an organization. Each function is attached with a list of processes. Each functional head in an organization is responsible for certain sets of processes made up of tasks which are to be executed and reported as planned. Multiple processes are aggregated to function accomplishments and multiple functions are aggregated to achieve organizational goals." [Business process management. Wikipedia]
This business process management life cycle diagram example was redesigned using the ConceptDraw PRO diagramming and vector drawing software from the Wikipedia file: Business Process Management Life-Cycle.svg. [en.wikipedia.org/ wiki/ File:Business_ Process_ Management_ Life-Cycle.svg]
This file is licensed under the Creative Commons Attribution-Share Alike 3.0 Unported license. [creativecommons.org/ licenses/ by-sa/ 3.0/ deed.en]
The circular arrows diagram example "BPM life cycle" is included in the Circular Arrows Diagrams solution from the area "What is a Diagram" of ConceptDraw Solution Park.
Circular arrows diagram
This circle diagram sample was redesigned from the Wikimedia Commons file: Research cycle.png. "Some of the basic elements of the scientific method, arranged in a cycle to emphasize that it is an iterative process." [commons.wikimedia.org/ wiki/ File:Research_ cycle.png]
This file is licensed under the Creative Commons Attribution 2.0 Generic license. [creativecommons.org/ licenses/ by/ 2.0/ deed.en]
"The scientific method is a body of techniques for investigating phenomena, acquiring new knowledge, or correcting and integrating previous knowledge. To be termed scientific, a method of inquiry must be based on empirical and measurable evidence subject to specific principles of reasoning. ...
Four essential elements of the scientific method are iterations, recursions, interleavings, or orderings of the following:
(1) Characterizations (observations, definitions, and measurements of the subject of inquiry).
(2) Hypotheses (theoretical, hypothetical explanations of observations and measurements of the subject).
(3) Predictions (reasoning including logical deduction from the hypothesis or theory).
(4) Experiments (tests of all of the above)...
A linearized, pragmatic scheme of the four points above is sometimes offered as a guideline for proceeding:
(1) Define a question.
(2) Gather information and resources (observe).
(3) Form an explanatory hypothesis.
(4) Test the hypothesis by performing an experiment and collecting data in a reproducible manner.
(5) Analyze the data.
(6) Interpret the data and draw conclusions that serve as a starting point for new hypothesis.
(7) Publish results.
(8) Retest (frequently done by other scientists).
The iterative cycle inherent in this step-by-step method goes from point 3 to 6 back to 3 again." [Scientific method. Wikipedia]
The circle diagram example "Research cycle" was created using the ConceptDraw PRO diagramming and vector drawing software extended with the Target and Circular Diagrams solution from the Marketing area of ConceptDraw Solution Park.
www.conceptdraw.com/ solution-park/ marketing-target-and-circular-diagrams
Circle diagram

This arrow circle diagram example was created on the base of the figure illustrating the webpage "Institutional Planning" from the Southside Virginia Community College website. "Planning at SVCC is a continuing process which is directed by four main influences. First, the President publishes the college's goals for the upcoming year. Second, academic programs and administrative units publish goals within their area of responsibility in support of the President's goals. Third, data on the college's students, programs, and initiatives are collected by a variety of studies and reports. Suggestions are also gathered from various stakeholders for the planning committee to consider. Fourth, the planning committee summarizes the information collected and the progress on meeting the current college goals. The committee then recommends items for the annual planning retreat to address. The planning retreat takes the recommendations of the planning retreat and publishes a planned response to ensure the attainment of the president's goals and to address the issues raised by the input process."
[southside.edu/ institutional-planning]
The arrow circle diagram example "Program assessment plan" was created using the ConceptDraw PRO diagramming and vector drawing software extended with the Target and Circular Diagrams solution from the Marketing area of ConceptDraw Solution Park.
www.conceptdraw.com/ solution-park/ marketing-target-and-circular-diagrams
Arrow circle diagram
This arrow circle diagram sample was redesigned from the Wikimedia Commons file: Loyalitätskreislauf-klein.jpg. [commons.wikimedia.org/ wiki/ File:Loyalit%C3%A4tskreislauf-klein.jpg]
This file is licensed under the Creative Commons Attribution-Share Alike 3.0 Unported license. [creativecommons.org/ licenses/ by-sa/ 3.0/ deed.en]
"Loyalty marketing is an approach to marketing, based on strategic management, in which a company focuses on growing and retaining existing customers through incentives. Branding, product marketing and loyalty marketing all form part of the customer proposition - the subjective assessment by the customer of whether to purchase a brand or not based on the integrated combination of the value they receive from each of these marketing disciplines.
The discipline of customer loyalty marketing has been around for many years...
In recent years, a new marketing discipline called "customer advocacy marketing" has been combined with or replaced "customer loyalty marketing." " [Loyalty marketing. Wikipedia]
The arrow circle diagram example "Loyalty" was created using the ConceptDraw PRO diagramming and vector drawing software extended with the Target and Circular Diagrams solution from the Marketing area of ConceptDraw Solution Park.
www.conceptdraw.com/ solution-park/ marketing-target-and-circular-diagrams
Arrow circle diagram
 Circular Arrows Diagrams
Circular Arrows Diagrams solution extends ConceptDraw PRO v10 with extensive drawing tools, predesigned samples, Circular flow diagram template for quick start, and a library of ready circular arrow vector stencils for drawing Circular Arrow Diagrams, Segmented Cycle Diagrams, and Circular Flow Diagrams. The elements in this solution help managers, analysts, business advisers, marketing experts, scientists, lecturers, and other knowledge workers in their daily work.
2 Circle Venn Diagram. Venn Diagram Example

BPR Diagram. Business Process Reengineering Example

 Target and Circular Diagrams
This solution extends ConceptDraw PRO software with samples, templates and library of design elements for drawing the Target and Circular Diagrams.
- Draw And Label A Product Life Cycle Diagram
- Water cycle diagram | Drawing Illustration | Drawing a Nature ...
- Life Cycle Diagram In Visio
- Product Life Cycle Diagram
- Vector Cycle Arrow Diagram
- Circle -Spoke Diagrams
- Water cycle diagram | Active indirect water heater diagram | Piping ...
- Strategic planning - Cycle diagram | Successful Strategic Plan ...
- Circle Diagrams | What Is a Circle Spoke Diagram ...
- Product life cycle process - Flowchart | Circular arrows diagram ...
- Cycle Diagram Software
- Circle Diagrams | How To Convert a Circle -Spoke Diagram to an ...
- How to Draw a Circular Arrows Diagram Using ConceptDraw PRO ...
- How To Create a Visio Circle -Spoke Diagram Using ConceptDraw ...
- Draw Flowcharts with ConceptDraw | Circular Arrows Diagrams ...
- Circle Diagram And Solution
- Circle Spoke Diagram Template | 3 Circle Venn Diagram . Venn ...
- 3 Circle Venn Diagram . Venn Diagram Example | Circles Venn ...
- 2 Circle Venn Diagrams
- Circular arrows diagram - Template | Circle -Spoke Diagrams | Circle ...