IDEF1X Standard

"The ideal telecommunication network has the following characteristics: broadband, multi-media, multi-point, multi-rate and economical implementation for a diversity of services (multi-services). The Broadband Integrated Services Digital Network (B-ISDN) intended to provide these characteristics. Asynchronous Transfer Mode (ATM) was promoted as a target technology for meeting these requirements" [Broadband networks. Wikipedia]
"Wireless broadband is technology that provides high-speed wireless Internet access or computer networking access over a wide area. ...
Wireless networks can feature data rates roughly equivalent to some wired networks, such as that of asymmetric digital subscriber line (ADSL) or a cable modem. Wireless networks can also be symmetrical, meaning the same rate in both directions (downstream and upstream), which is most commonly associated with fixed wireless networks. A fixed wireless network link is a stationary terrestrial wireless connection, which can support higher data rates for the same power as mobile or satellite systems.
Few wireless Internet service providers (WISPs) provide download speeds of over 100 Mbit/ s; most broadband wireless access (BWA) services are estimated to have a range of 50 km (31 mi) from a tower. Technologies used include LMDS and MMDS, as well as heavy use of the ISM bands and one particular access technology was standardized by IEEE 802.16, with products known as WiMAX." [Wireless broadband. Wikipedia]
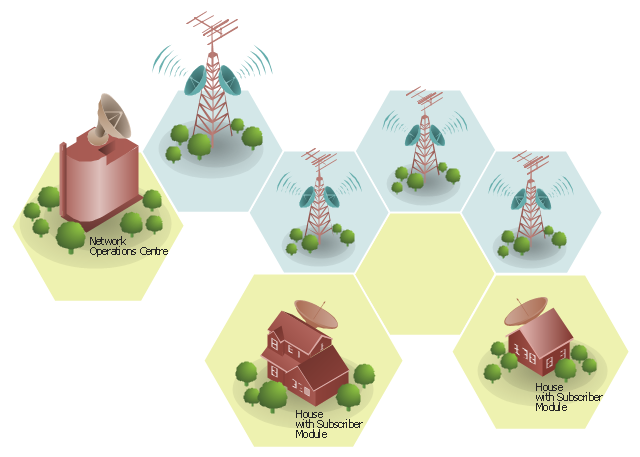
Wireless broadband is technology that provides high-speed wireless Internet access or computer networking access over a wide area. [Wireless broadband. Wikipedia]
This wireless broadband network diagram example was created using the ConceptDraw PRO diagramming and vector drawing software extended with the Telecommunication Network Diagrams solution from the Computer and Networks area of ConceptDraw Solution Park.
"Wireless broadband is technology that provides high-speed wireless Internet access or computer networking access over a wide area. ...
Wireless networks can feature data rates roughly equivalent to some wired networks, such as that of asymmetric digital subscriber line (ADSL) or a cable modem. Wireless networks can also be symmetrical, meaning the same rate in both directions (downstream and upstream), which is most commonly associated with fixed wireless networks. A fixed wireless network link is a stationary terrestrial wireless connection, which can support higher data rates for the same power as mobile or satellite systems.
Few wireless Internet service providers (WISPs) provide download speeds of over 100 Mbit/ s; most broadband wireless access (BWA) services are estimated to have a range of 50 km (31 mi) from a tower. Technologies used include LMDS and MMDS, as well as heavy use of the ISM bands and one particular access technology was standardized by IEEE 802.16, with products known as WiMAX." [Wireless broadband. Wikipedia]
Wireless broadband is technology that provides high-speed wireless Internet access or computer networking access over a wide area. [Wireless broadband. Wikipedia]
This wireless broadband network diagram example was created using the ConceptDraw PRO diagramming and vector drawing software extended with the Telecommunication Network Diagrams solution from the Computer and Networks area of ConceptDraw Solution Park.
Wireless broadband network diagram
This TQM diagram example was redesigned from the illustration of the Highway Performance Monitoring System (HPMS) Field Manual from the website of the Federal Highway Administration (FHWA).
[fhwa.dot.gov/ policyinformation/ hpms/ fieldmanual/ chapter7.cfm]
"Highway Performance Monitoring System (HPMS).
The HPMS is a national level highway information system that includes data on the extent, condition, performance, use and operating characteristics of the nation's highways. The HPMS contains administrative and extent of system information on all public roads, while information on other characteristics is represented in HPMS as a mix of universe and sample data for arterial and collector functional systems. Limited information on travel and paved miles is included in summary form for the lowest functional systems.
HPMS was developed in 1978 as a continuing database, replacing the special biennial condition studies that had been conducted since 1965. The HPMS has been modified several times since its inception. Changes have been made to reflect changes in the highway systems, legislation, and national priorities, to reflect new technology, and to consolidate or streamline reporting requirements." [fhwa.dot.gov/ policyinformation/ hpms.cfm]
The TQM flowchart example "Software workflow diagram" was created using the ConceptDraw PRO diagramming and vector drawing software extended with the Total Quality Management (TQM) Diagrams solution from the Quality area of ConceptDraw Solution Park.
TQM diagram

 Venn Diagrams
Venn Diagrams are actively used to illustrate simple set relationships in set theory and probability theory, logic and statistics, mathematics and computer science, linguistics, sociology, and marketing. Venn Diagrams are also often used to visually summarize the status and future viability of a project.
ConceptDraw Arrows10 Technology

- Fully Connected Network Topology Diagram | Star Network ...
- The Best Choice for Creating Diagram | Team psychological ...
- Concept map - Team psychological characteristics | Block Diagrams ...
- Computer Networks Service Characteristics Diagram
- Fully Connected Network Topology Diagram | Star Network ...
- Characteristics Of A Star Topology
- Characteristics Of Bus Topology
- Process Flowchart | The Best Choice for Creating Diagram ...
- Flowcharts For Characteristics Of Management
- Network Diagram Characteristics
- Concept Evaluation Characteristics Of Internet Diagrams
- Show The Schematic Diagram Characteristics Of Service Marketing
- What Characteristics Of Data Are Represented In An Er Diagram
- Network Topology Diagrams Characteristics
- Characteristics Of Campus Area Network
- Fully Connected Network Topology Diagram | Campus Area ...
- Main Characteristics Of Business With Example For Each
- Broadband Diagram With Labels
- Concept Mapping | Team psychological characteristics - Concept ...
- Safety and Security | Team psychological characteristics - Concept ...