Business Process Flowchart Symbols

Process Flowchart


 Logistics Flow Charts
Logistics Flow Charts solution extends ConceptDraw DIAGRAM functionality with opportunities of powerful logistics management software. It provides large collection of predesigned vector logistic symbols, pictograms, objects and clipart to help you design with pleasure Logistics flow chart, Logistics process flow diagram, Inventory flow chart, Warehouse flowchart, Warehouse management flow chart, Inventory control flowchart, or any other Logistics diagram. Use this solution for logistics planning, to reflect logistics activities and processes of an enterprise or firm, to depict the company's supply chains, to demonstrate the ways of enhancing the economic stability on the market, to realize logistics reforms and effective products' promotion.
Purchasing Flowchart - Purchase Order. Flowchart Examples

 Business Package for Management
Package intended for professional who designing and documenting business processes, preparing business reports, plan projects and manage projects, manage organizational changes, prepare operational instructions, supervising specific department of an organization, workout customer service processes and prepare trainings for customer service personal, carry out a variety of duties to organize business workflow.
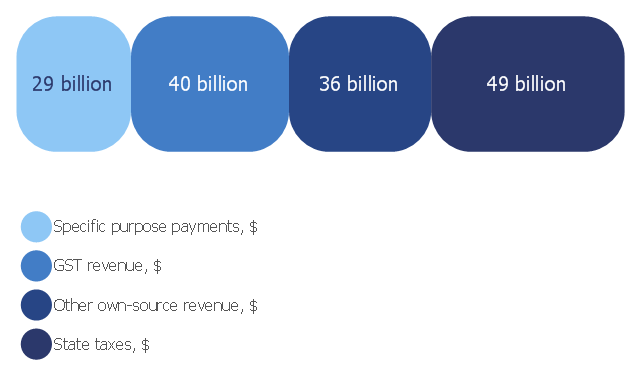
This divided bar diagram sample shows composition of Australian state government revenue in 2006‑2007. It was drawn on the base of the chart "Composition of state government revenue in 2006‑07" from the Australia's future tax system website.
[taxreview.treasury.gov.au/ content/ Paper.aspx?doc=html/ publications/ papers/ report/ section_ 10-06.htm]
"Government revenue is money received by a government. It is an important tool of the fiscal policy of the government and is the opposite factor of government spending. Revenues earned by the government are received from sources such as taxes levied on the incomes and wealth accumulation of individuals and corporations and on the goods and services produced, exported and imported from the country, non-taxable sources such as government-owned corporations' incomes, central bank revenue and capital receipts in the form of external loans and debts from international financial institutions." [Government revenue. Wikipedia]
The divided bar diagram example "Composition of state government revenue in 2006‑07" was created using the ConceptDraw PRO diagramming and vector drawing software extended with the Divided Bar Diagrams solution from the Graphs and Charts area of ConceptDraw Solution Park.
Divided bar chart
Geo Map — Europe — Germany

Fundraising Pyramid

- Flowchart design. Flowchart symbols, shapes, stencils and icons ...
- A single currency to boots the Single Market | Cloud round icons ...
- Motivation Symbol Png
- Service- goods continuum diagram | AWS Architecture Diagrams ...
- Cause and effect diagram - Increase in productivity | Ecosystem ...
- Business Icon
- Ecosystem goods and services - Segmented pyramid diagram ...
- Picture graph - Template | Manufacturing in America | Total value of ...
- France exports of goods and services | Ecosystem goods and ...