 Interactive Voice Response Diagrams
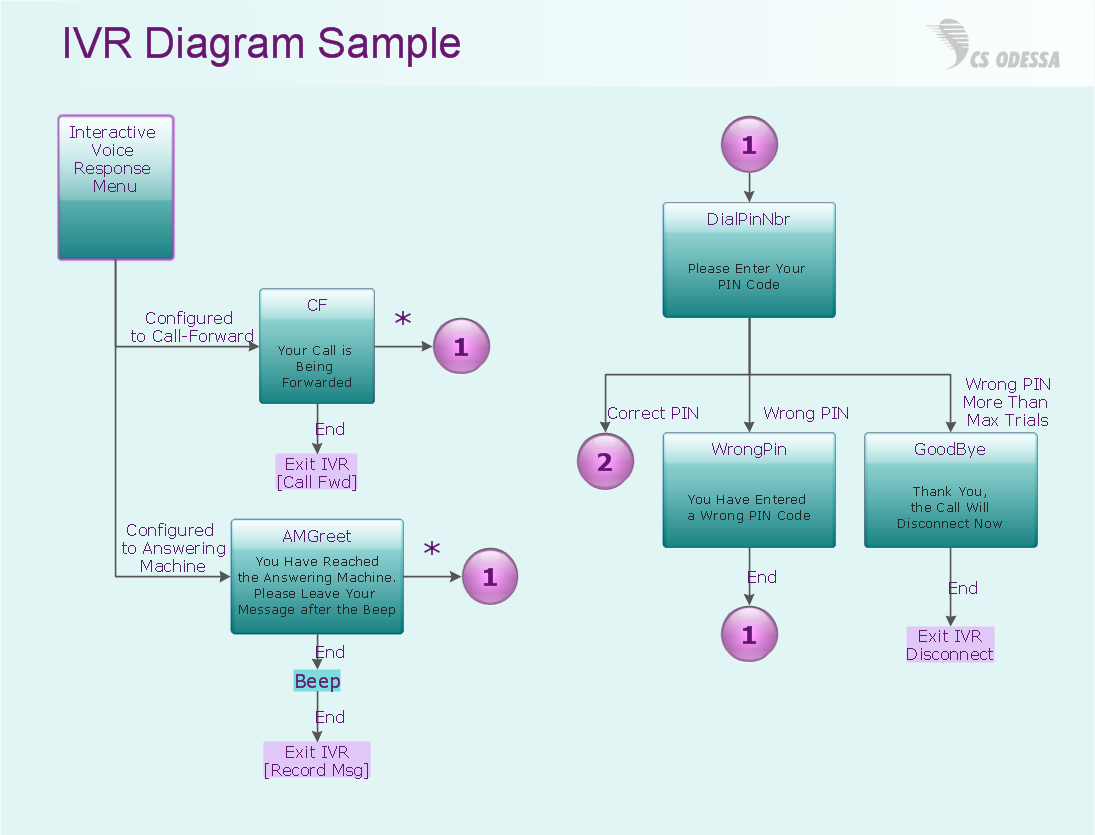
Interactive Voice Response Diagrams solution extends ConceptDraw DIAGRAM software with samples, templates and libraries of ready-to-use vector stencils that help create Interactive Voice Response (IVR) diagrams illustrating in details a work of interactive voice response system, the IVR system’s logical and physical structure, Voice-over-Internet Protocol (VoIP) diagrams, and Action VoIP diagrams with representing voice actions on them, to visualize how the computers interact with callers through voice recognition and dual-tone multi-frequency signaling (DTMF) keypad inputs.
Interactive Voice Response Network Diagram


Network Diagram Examples

 Telecommunication Network Diagrams
Telecommunication Network Diagrams solution extends ConceptDraw DIAGRAM software with samples, templates, and great collection of vector stencils to help the specialists in a field of networks and telecommunications, as well as other users to create Computer systems networking and Telecommunication network diagrams for various fields, to organize the work of call centers, to design the GPRS networks and GPS navigational systems, mobile, satellite and hybrid communication networks, to construct the mobile TV networks and wireless broadband networks.
 Meter Dashboard
Meter dashboard solution extends ConceptDraw DIAGRAM software with templates, samples and vector stencils library with meter indicators for drawing visual dashboards showing quantitative data.
HelpDesk
How to Create a Telecommunication Network Diagram

 Business Intelligence Dashboard
Business Intelligence Dashboard solution extends the ConceptDraw DIAGRAM functionality with exclusive tools, numerous ready-to-use vector objects, samples and quick-start templates for creation professional Business Intelligence Dashboards, Business Intelligence Graphics, Business Intelligence Charts and Maps of different kinds. Design easy the BI dashboard, BI model or Dynamic chart in ConceptDraw DIAGRAM to monitor the company's work, to track the indicators corresponding your company's data, to display and analyze key performance indicators, to evaluate the trends and regularities of the processes occurring at the company.
- Call center network diagram | IVR Network Diagram ...
- Telecom Call Centre Architecture
- Call center network diagram | Computers and network isometric ...
- Network VOIP. Computer and Network Examples | Call center ...
- Call Centre Network Diagram
- Call center network diagram | Telecommunication Network ...
- Call Center Workflow Diagram
- Telecoms Call Centre Architecture
- Call center network diagram | Network Diagram Examples | How to ...
- Call center network diagram | How to Draw a Computer Network ...
- Schematic Diagram Of A Call Centre
- Call center network diagram | IVR Network Diagram | Interactive ...
- Call center network diagram | How to Draw a Computer Network ...
- Call center network diagram | Rack Diagrams | Telecommunication ...
- VoIP call with SIM box and gateway | Network Diagram Examples ...
- Call center network diagram | Network Diagram Examples ...
- Call center network diagram | Call shop solution | VoIP call with SIM ...
- Software Defined Networking System Overview | Call center network ...
- Call Centre Network Devices