How To Draw Building Plans
Building Plan is the basis for implementation construction and repair works. Creation of Building Plans is the main purpose of architects and designers. They are required and even obligatory for builders to accurately implement your wishes and ideas during the building, designing or redesigning your home, flat, office, or any other premise. ConceptDraw PRO is a powerful quick building plan software for creating great-looking Office layouts, Home floor plans, Commercial floor plans, Storage building plans, Expo and Shopping mall building plans, School and Training building plans, Cafe or Restaurant plans, Gym and Spa area plans, Sport field plans, House interior designs, Electric and Telecom building plans, Fire and Emergency plans, HVAC plans, Security and Access plans, Plumbing and Piping plans, Plant layouts, etc. Use helpful samples, templates and variety of libraries with numerous building design elements from Floor Plans solution for ConceptDraw PRO software to facilitate design drawing process.
Emergency Plan
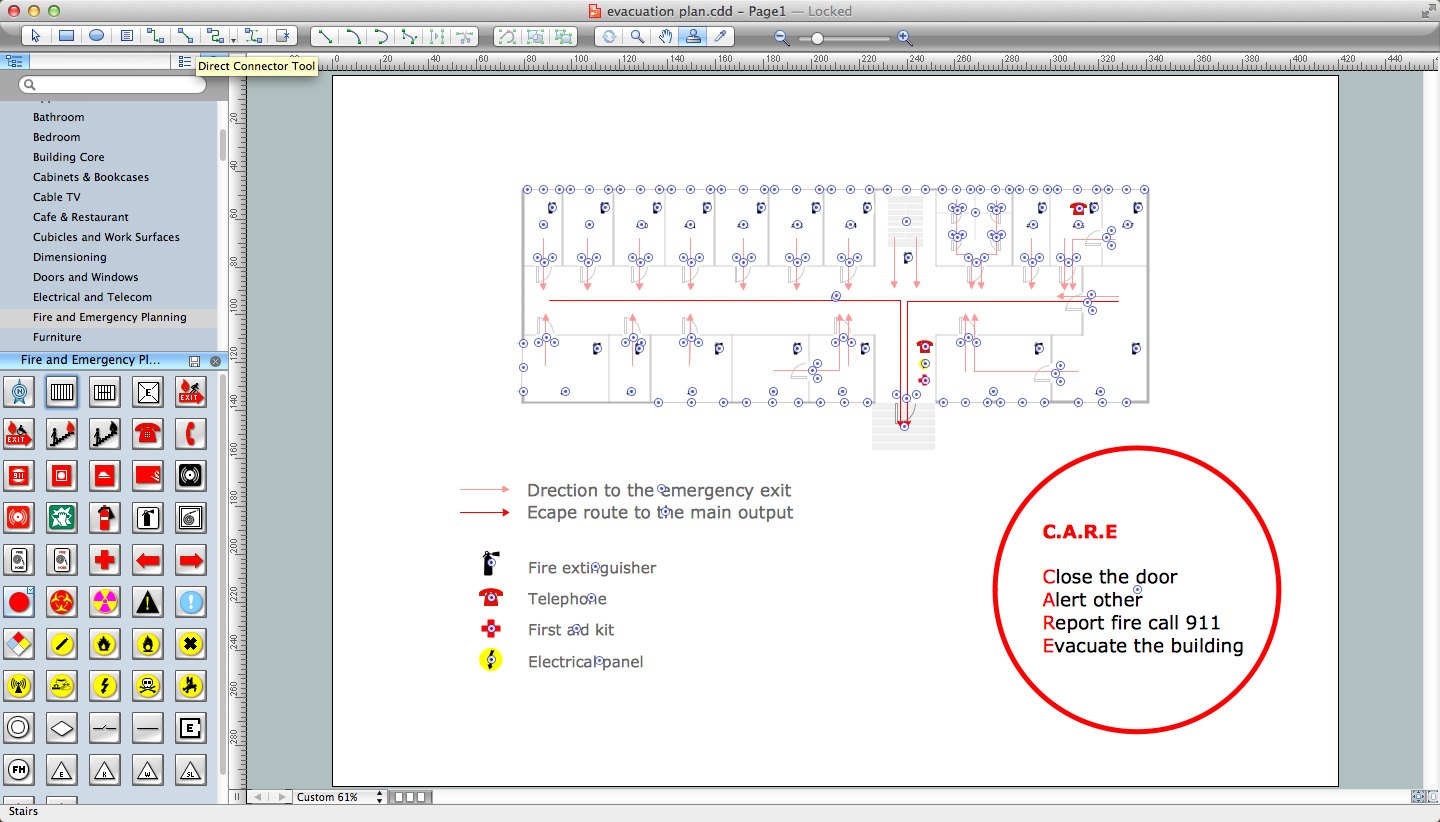
The Fire Emergency Plan illustrates the scheme of the building and location of the main and fire exits for a safe evacuation, and clearly defines directions to them on the plan. Fire Emergency Plans are constructed on the case of unexpected or emergency situations, fires, hazardous leaks, natural disasters, and other sudden events. They must to be obligatorily on the plain sight at every building and on each floor, at living houses and apartments, schools and universities, medical centers, clinics and hospitals, office buildings, banks, cafes, restaurants, and also at all other public buildings and institutions. The Evacuation plans and Emergency Plans preliminary designed in ConceptDraw PRO software help employees and family members when some emergency events happen and let avoid the accidents and sad consequences, prevent injuries and fatalities, allow reduce damages and speed the work resumption. Start drawing emergency blueprint from floor bounds, then add the inner walls and doors, and finally use bright arrows to visually show evacuation directions to fire exits. ConceptDraw is a serious alternative to Visio. It's a desktop based solution aimed at professional designers working in CAD environments. It is also a good option for those who work between Mac and PC because one license is valid for both.
HelpDesk
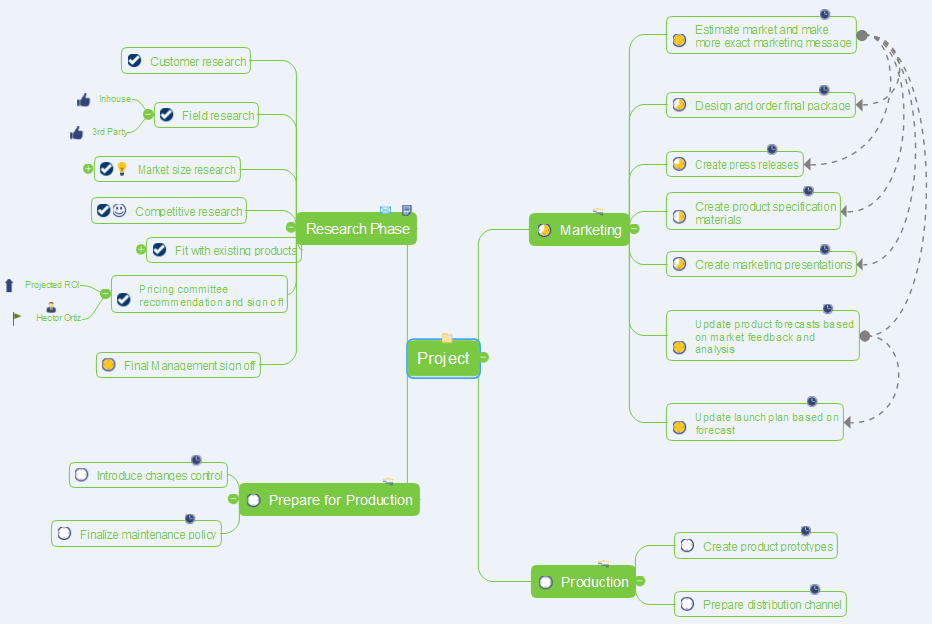
How to Make a Project Tasks Mind Map from Brainstorm
Start project with creating a mind map, structuring ideas captured during a brainstorming session.HelpDesk
How to Create a Time Series Dashboard
Time Series Dashboard means an integration of some type of diagrams: Line Charts, Bar Charts, Column Charts, and Dot Plots on a single space. The ConceptDraw Time Series Dashboard solution can be used to create the interactive Time Series dashboard. The libraries of Time Series Charts solution contain the Live Objects, that can change their appearance depending on the external data. Each chart from the Time Series dashboard displays particular source data. You can include Time Series Charts in your business or technical dashboards to show and compare the items changing over time.HelpDesk
How to Post Tweets in Full Screen Mode
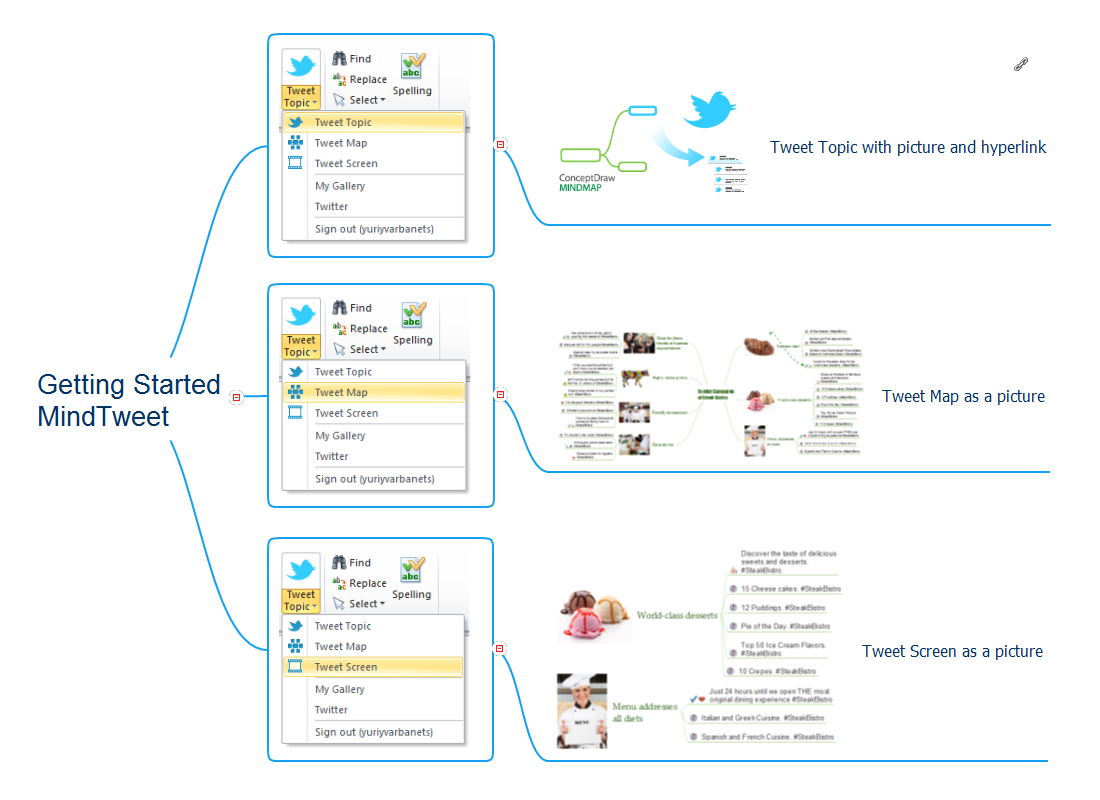
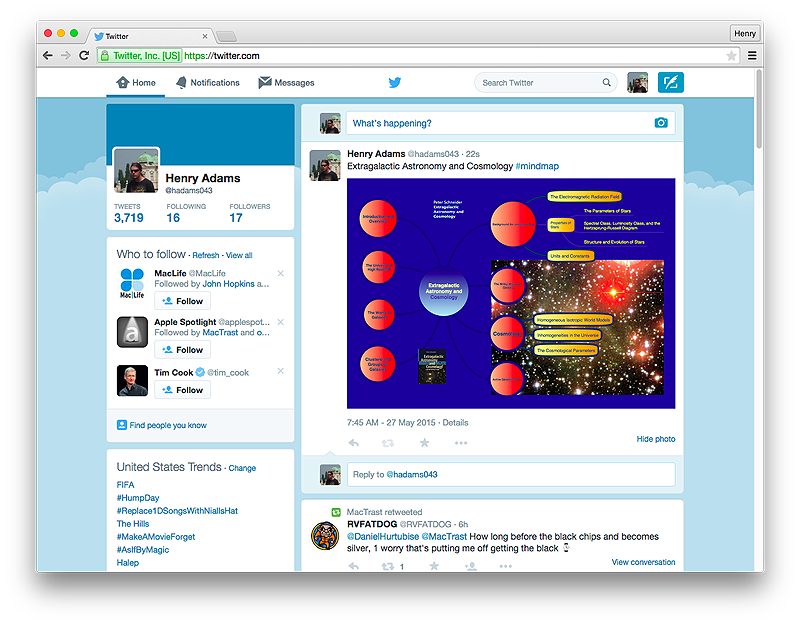
MindTweet solution provides the ability to manage the sending of Tweets using mind maps. In this article we will give you helpful tips on how to operate with MindTweet.
HelpDesk
How to Use MindTweet Solution
MindTweet solution provides the ability to manage the sending of Tweets using mind maps.
HelpDesk
How to Edit Slides with Slide Navigator
Instructions on how to operate with Slide navigation toolHelpDesk
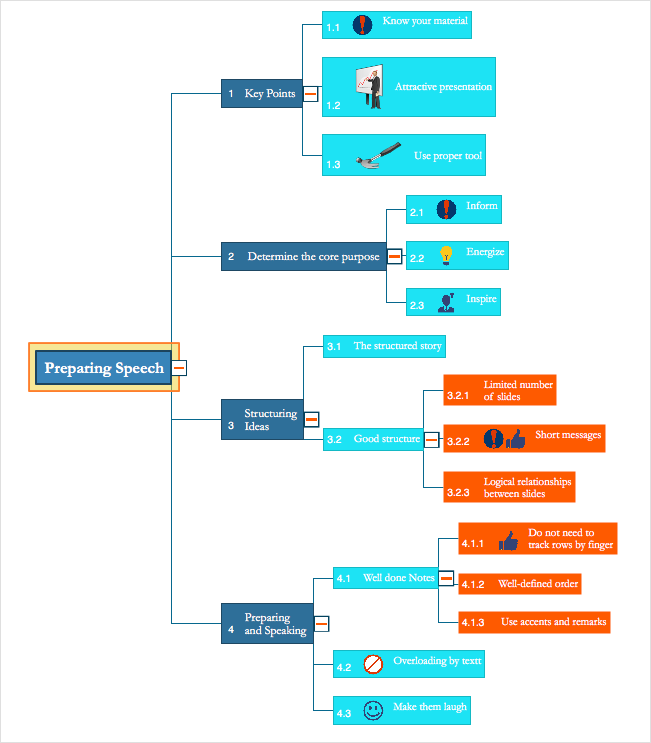
How to Format a Mind Map on Mac
Using ConceptDraw MINDMAP formatting capabilities is useful for creating aesthetically appealing mind map which can be the key to effective presentation of your ideasБ.PROBLEM ANALYSIS. Identify and Structure Factors
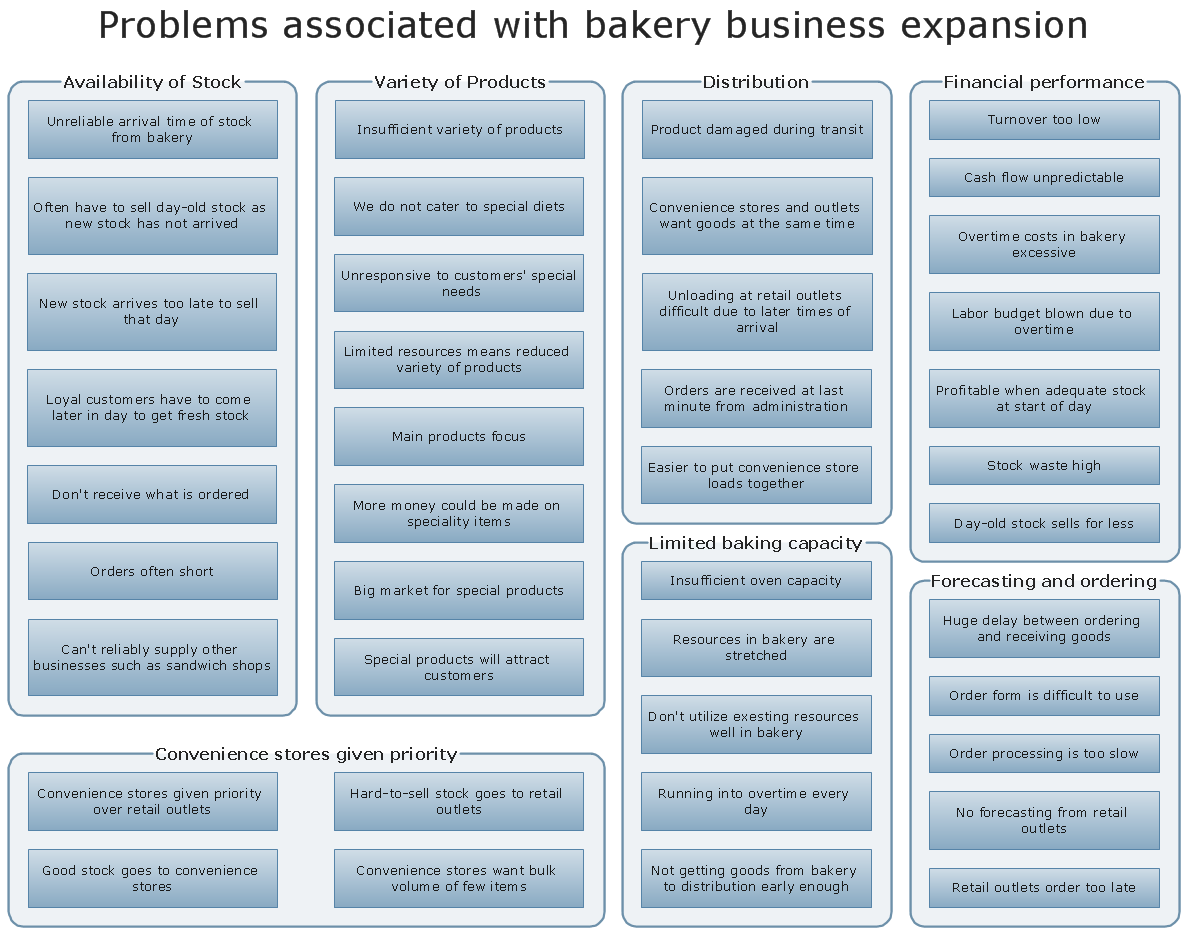
Identify and Structure Factors. Use the Affinity Diagram to collect and structure factors that impact on a problem. ConceptDraw Office suite is a software for identify and structure factors with affinity diagram. This is a grouping and structuring of factors that impact on a problem.
HelpDesk
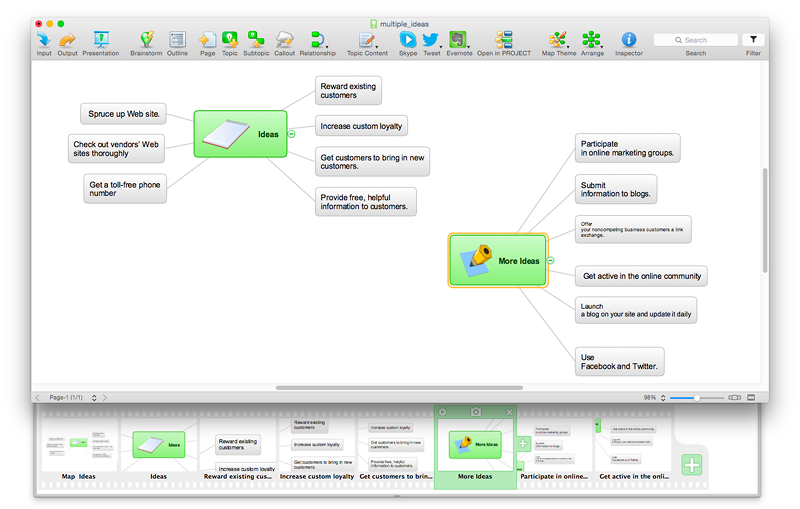
How to Present a Mind Map with Multiple Main Ideas
The simplest way to create a presentation from your map is by creating Default Presentation, but it will not display slides for additional Main Ideas and their topics. This article describes how you can do this.
HelpDesk
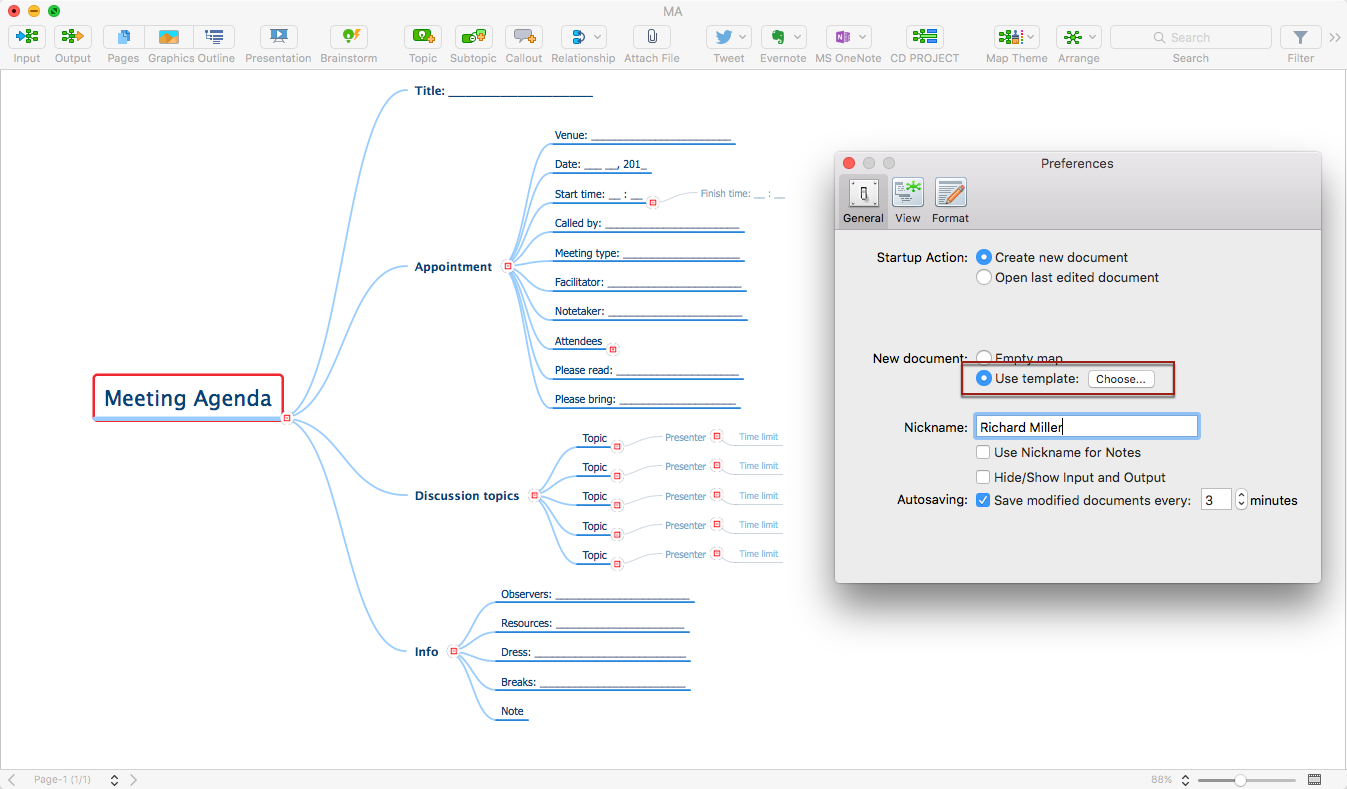
How to Start Mind Mapping from a Custom Template
In this article, find out how you can make your favorite template the default map when launching ConceptDraw MINDMAP.
Problem Analysis
ConceptDraw Office suite is a software for Problem Analysis. The Seven Management and Planning Tools are a set of such tools for investigating complex problems. These tools are exemplary at organizing research, parsing complex problems, providing a structure for the details, helping managers make decisions, and organizing effective communications in a visual manner that keeps everyone involved
HelpDesk
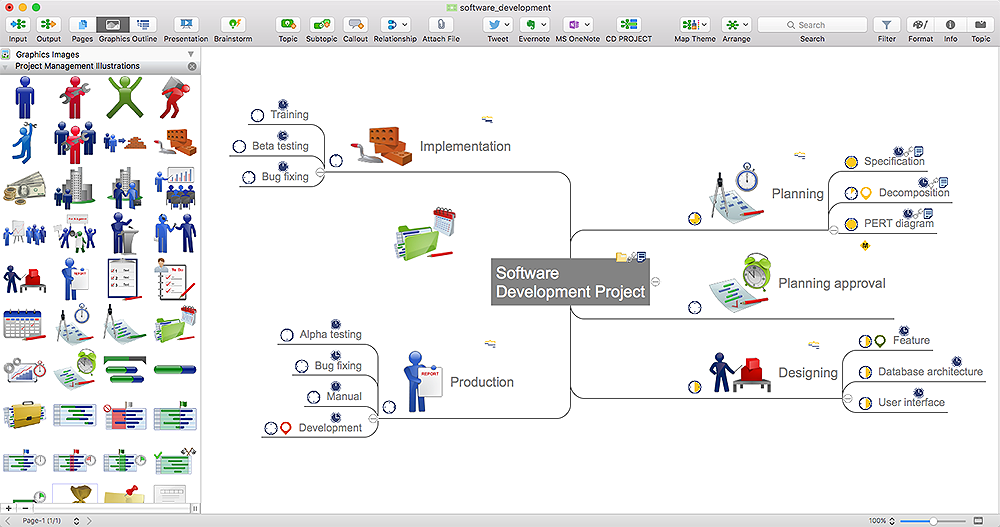
How to Connect an Image to a Topic in Your Mind Map
ConceptDraw MINDMAP gives a possibility to connect image to topic making your mind map more memorable and brain friendly. You can add images to any element of a map.HelpDesk
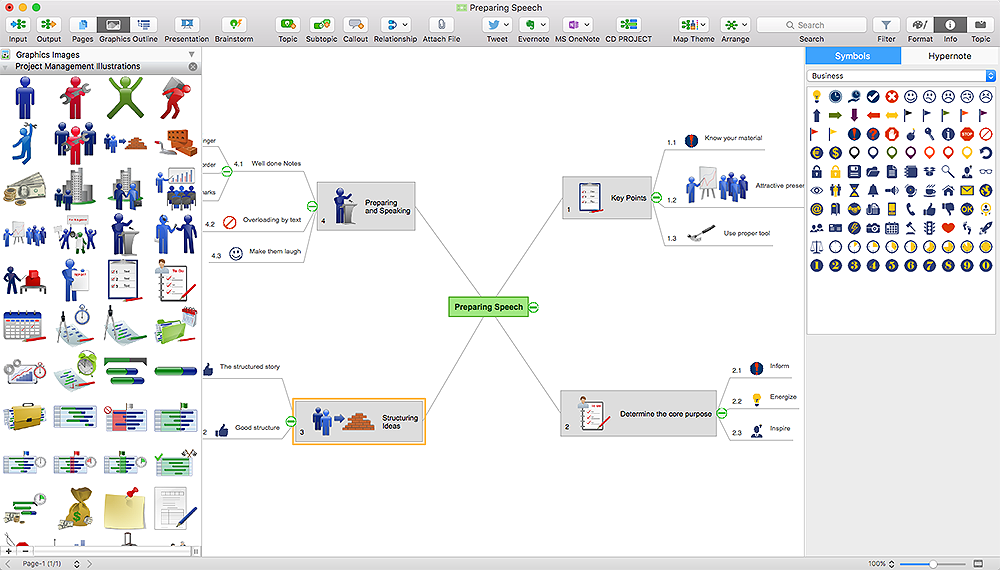
How to Create a Mind Map on Mac
Step-by-step guide on how to create a mind map on Mac using ConceptDraw MINDMAPHelpDesk

